Office Depot 2011 Annual Report Download - page 34
Download and view the complete annual report
Please find page 34 of the 2011 Office Depot annual report below. You can navigate through the pages in the report by either clicking on the pages listed below, or by using the keyword search tool below to find specific information within the annual report.-
 1
1 -
2
-
3
-
4
-
5
-
6
-
7
-
8
-
9
-
10
-
11
-
12
-
13
-
14
-
15
-
16
-
17
-
18
-
19
-
20
-
21
-
22
-
23
-
 24
24 -
 25
25 -
 26
26 -
 27
27 -
 28
28 -
 29
29 -
 30
30 -
 31
31 -
 32
32 -
 33
33 -
 34
34 -
 35
35 -
 36
36 -
 37
37 -
 38
38 -
 39
39 -
 40
40 -
 41
41 -
 42
42 -
 43
43 -
 44
44 -
45
-
46
-
47
-
48
-
49
-
50
-
51
-
52
-
53
-
54
-
55
-
56
-
57
-
58
-
59
-
60
-
61
-
62
-
63
-
64
-
65
-
66
-
67
-
68
-
69
-
70
-
71
-
72
-
73
-
74
-
75
-
76
-
77
-
78
-
79
-
80
-
81
-
82
-
83
-
84
-
85
-
86
-
87
-
88
-
89
-
90
-
91
-
92
-
93
-
94
-
95
-
96
-
97
-
98
-
99
-
100
-
101
-
102
-
103
-
104
-
105
-
106
-
107
-
108
-
109
-
110
-
111
-
112
-
113
-
114
-
115
-
116
-
117
-
118
-
119
-
120
-
121
-
122
-
123
-
124
-
125
-
126
-
127
-
128
-
129
-
130
-
131
-
132
-
133
-
134
-
135
-
136
-
137
-
138
-
139
-
140
-
141
-
142
-
143
-
144
-
145
-
146
-
147
-
148
-
149
-
150
-
151
-
152
-
153
-
154
-
155
-
156
-
157
-
158
-
159
-
160
-
161
-
162
-
163
-
164
-
165
-
166
-
167
-
168
-
169
-
170
-
171
-
172
-
173
-
174
-
175
-
176
-
177
-
178
-
179
-
180
-
181
-
182
-
183
-
184
-
185
-
186
-
187
-
188
-
189
-
190
-
191
-
192
-
193
-
194
-
195
-
196
-
197
-
198
-
199
-
200
-
201
-
202
-
203
-
204
-
205
-
206
-
207
-
208
-
209
-
210
-
211
-
212
-
213
-
214
-
215
-
216
-
217
-
218
-
219
-
220
-
221
-
222
-
223
-
224
-
225
-
226
-
227
-
228
-
229
-
230
-
231
-
232
-
233
-
234
-
235
-
236
-
237
-
238
-
239
-
240
 |
 |
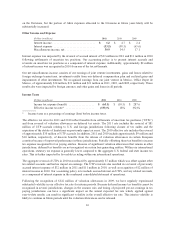
rebates. Generally, our product costs per unit decline as higher volumes of purchases are reached. Certain of our
vendor agreements provide that we pay higher per unit costs prior to reaching a predetermined tier, at which time
the vendor rebates the per unit differential on past purchases, and also applies the lower cost to future purchases
until the next milestone is reached. Current accounting rules provide that companies with a sound basis for
estimating their full year purchases, and therefore the ultimate rebate level, can use that estimate to value
inventory and cost of goods sold throughout the year. We believe our history of purchases with many vendors
provides us with a sound basis for our estimates of purchase volume. If the anticipated volume of purchases is
not reached, however, or if we form the belief at any given point in the year that it is not likely to be reached,
cost of goods sold and the remaining inventory balances are adjusted to reflect that change in our outlook. We
review sales projections and related purchases against vendor program estimates at least quarterly and adjust
these balances accordingly. In recent years, the company has reduced the number of arrangements that contain
this tiered purchase rebate mechanism in exchange for a lower product cost throughout the year. Continued
elimination of tiered arrangements could further reduce the potential variability in gross margin from changes in
volume-based estimates.
The second broad category of arrangements with our vendors is event-based programs. These arrangements can
take many forms, including advertising support, special pricing offered by certain of our vendors for a limited
time, payments for special placement or promotion of a product, reimbursement of costs incurred to launch a
vendor’s product, and various other special programs. These payments are classified as a reduction of costs of
goods sold or inventory, as appropriate for the program. Some arrangements may meet the specific, incremental,
identifiable cost criteria that allow for direct operating expense offset, but such arrangements are not significant.
Vendor rebates are recognized throughout the year based on judgment and estimates and amounts due from
vendors are generally settled throughout the year based on purchase volumes. The final amounts due from
vendors are generally known soon after year-end. Substantially all vendor program receivables outstanding at the
end of the year are settled within the three months immediately following year-end. We believe that our historic
collection rates of these receivables provide a sound basis for our estimates of anticipated vendor payments
throughout the year.
Inventory valuation — Inventories are valued at the lower of cost or market value. We monitor active inventory
for excessive quantities and slow-moving items and record adjustments as necessary to lower the value if the
anticipated realizable amount is below cost. We also identify merchandise that we plan to discontinue or have
begun to phase out and assess the estimated recoverability of the carrying value. This includes consideration of
the quantity of the merchandise, the rate of sale, and our assessment of current and projected market conditions
and anticipated vendor rebates. If necessary, we record a charge to cost of sales to reduce the carrying value of
this merchandise to our estimate of the lower of cost or realizable amount. Additional promotional activities may
be initiated and markdowns may be taken as considered appropriate until the product is sold or otherwise
disposed. Estimates and judgments are required in determining what items to stock and at what level, and what
items to discontinue and how to value them prior to sale.
We also recognize an expense in cost of sales for our estimate of physical inventory loss from theft, short
shipment and other factors – referred to as inventory shrink. During the year, we adjust the estimate of our shrink
rate accrual following on-hand adjustments and our physical inventory results. These changes in estimates may
result in volatility within the year or impact comparisons to other periods.
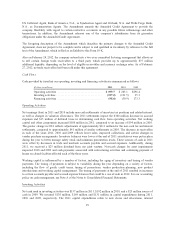
Closed store accruals and asset impairments — We regularly assess the performance of each retail store against
historic patterns and projections of future profitability. These assessments are based on management’s estimates
for sales levels, gross margin attainments, and cash flow generation. If, as a result of these evaluations,
management determines that a store will not achieve certain operating performance targets, we may decide to
close the store. At the point of closure, we recognize a liability for the remaining costs related to the property,
reduced by an estimate of any sublease income. The calculation of this liability requires us to make assumptions
and to apply judgment regarding the remaining term of the lease (including vacancy period), anticipated sublease
32