Office Depot 2011 Annual Report Download - page 219
Download and view the complete annual report
Please find page 219 of the 2011 Office Depot annual report below. You can navigate through the pages in the report by either clicking on the pages listed below, or by using the keyword search tool below to find specific information within the annual report.-
 1
1 -
2
-
3
-
4
-
5
-
6
-
7
-
8
-
9
-
10
-
11
-
12
-
13
-
14
-
15
-
16
-
17
-
18
-
19
-
20
-
21
-
22
-
23
-
24
-
25
-
26
-
27
-
28
-
29
-
30
-
31
-
32
-
33
-
34
-
35
-
36
-
37
-
38
-
39
-
40
-
41
-
42
-
43
-
44
-
45
-
46
-
47
-
48
-
49
-
50
-
51
-
52
-
53
-
54
-
55
-
56
-
57
-
58
-
59
-
60
-
61
-
62
-
63
-
64
-
65
-
66
-
67
-
68
-
69
-
70
-
71
-
72
-
73
-
74
-
75
-
76
-
77
-
78
-
79
-
80
-
81
-
82
-
83
-
84
-
85
-
86
-
87
-
88
-
89
-
90
-
91
-
92
-
93
-
94
-
95
-
96
-
97
-
98
-
99
-
100
-
101
-
102
-
103
-
104
-
105
-
106
-
107
-
108
-
109
-
110
-
111
-
112
-
113
-
114
-
115
-
116
-
117
-
118
-
119
-
120
-
121
-
122
-
123
-
124
-
125
-
126
-
127
-
128
-
129
-
130
-
131
-
132
-
133
-
134
-
135
-
136
-
137
-
138
-
139
-
140
-
141
-
142
-
143
-
144
-
145
-
146
-
147
-
148
-
149
-
150
-
151
-
152
-
153
-
154
-
155
-
156
-
157
-
158
-
159
-
160
-
161
-
162
-
163
-
164
-
165
-
166
-
167
-
168
-
169
-
170
-
171
-
172
-
173
-
174
-
175
-
176
-
177
-
178
-
179
-
180
-
181
-
182
-
183
-
184
-
185
-
186
-
187
-
188
-
189
-
190
-
191
-
192
-
193
-
194
-
195
-
196
-
197
-
198
-
199
-
200
-
201
-
202
-
203
-
204
-
205
-
206
-
207
-
208
-
 209
209 -
 210
210 -
 211
211 -
 212
212 -
 213
213 -
 214
214 -
 215
215 -
 216
216 -
 217
217 -
 218
218 -
 219
219 -
 220
220 -
 221
221 -
 222
222 -
 223
223 -
 224
224 -
 225
225 -
 226
226 -
 227
227 -
 228
228 -
 229
229 -
230
-
231
-
232
-
233
-
234
-
235
-
236
-
237
-
238
-
239
-
240
 |
 |

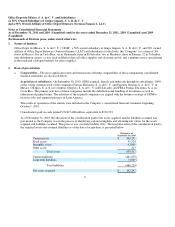
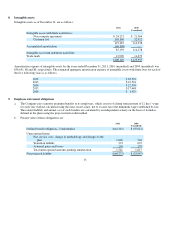
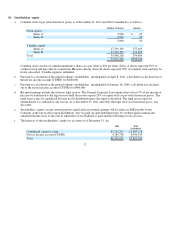
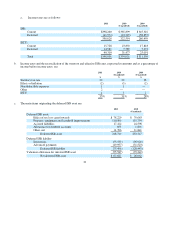
Depreciation is calculated using the straight-line method based on the useful lives of the related assets, as follows:
The useful lives of fixed assets are reviewed at least annually to determine whether events and circumstances warrant a
revision.
11
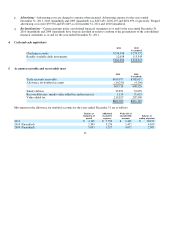
c. Cash and cash equivalents
—
Cash and cash equivalents consist mainly of bank deposits in checking accounts and readily
available daily investments of cash surpluses. Cash and cash equivalents are stated at nominal value plus accrued yields,
which are recognized in results as they accrue. The Company considers all short-term highly-liquid debt instruments
p
urchased with an ori
g
inal maturit
y
of three months or less to be cash e
q
uivalents.
d. Concentration of credit risk
—
The Company sells products to customers primarily in the retail trade in Mexico. The
Company conducts periodic evaluations of its customers’ financial condition and generally does not require collateral. The
Company does not believe that significant risk of loss from a concentration of credit risk exists given the large number of
customers that comprise its customer base and their geographical dispersion. The Company also believes that its potential
credit risk is ade
q
uatel
y
covered b
y
the allowance for doubtful accounts.
e.
I
nventories and cost of sales
—
Inventories are stated at the lower of cost or realizable value. Cost is determined using the
avera
g
e cost method.
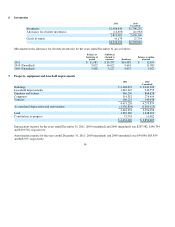
f.
P
roperty, equipment and leasehold improvements
—
Property, equipment and leasehold improvements are recorded at
acquisition cost. Balances from acquisitions made through December 31, 2007, were restated for the effects of inflation by
a
pp
l
y
in
g
factors derived from the NCPI throu
g
h that date.
Average years
Buildin
g
s
40
Leasehold im
p
rovements
9-25
Furniture and fixtures
4-10
Com
p
uters
4
Vehicles
4-8
g.
I
mpairment of long-lived assets in use
—
The Company reviews the carrying amounts of long-lived asset in use, other than
goodwill and intangible assets with indefinite useful lives, when an impairment indicator suggests that such amounts might
not be recoverable, considering the greater of the present value of future net cash flows or the net sales price upon disposal.
Impairment is recorded when the carrying amounts exceed the greater of the aforementioned amounts. Impairment
indicators considered for these purposes are, among others, operating losses or negative cash flows in the period if they are
combined with a history or projection of losses, depreciation and amortization charged to results, which in percentage
terms in relation to revenues are substantially higher than that of previous years, obsolescence, competition and other legal
and economic factors.
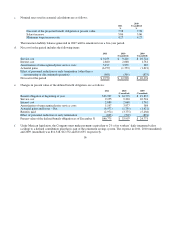
h. Goodwill and intangible assets
—
Goodwill represents the excess of consideration paid over the fair value of the net assets
acquired in subsidiary shares, as of the date of acquisition. Through December 31, 2007, goodwill was restated for the
effects of inflation using the NCPI. Intangible assets with indefinite useful lives are carried at cost. Goodwill and intangible
assets with indefinite useful lives are not amortized and are subject to impairment tests at least once a year, based on the
methodolo
gy
described in Note 3.
g
above.