Office Depot 2011 Annual Report Download - page 238
Download and view the complete annual report
Please find page 238 of the 2011 Office Depot annual report below. You can navigate through the pages in the report by either clicking on the pages listed below, or by using the keyword search tool below to find specific information within the annual report.-
 1
1 -
2
-
3
-
4
-
5
-
6
-
7
-
8
-
9
-
10
-
11
-
12
-
13
-
14
-
15
-
16
-
17
-
18
-
19
-
20
-
21
-
22
-
23
-
24
-
25
-
26
-
27
-
28
-
29
-
30
-
31
-
32
-
33
-
34
-
35
-
36
-
37
-
38
-
39
-
40
-
41
-
42
-
43
-
44
-
45
-
46
-
47
-
48
-
49
-
50
-
51
-
52
-
53
-
54
-
55
-
56
-
57
-
58
-
59
-
60
-
61
-
62
-
63
-
64
-
65
-
66
-
67
-
68
-
69
-
70
-
71
-
72
-
73
-
74
-
75
-
76
-
77
-
78
-
79
-
80
-
81
-
82
-
83
-
84
-
85
-
86
-
87
-
88
-
89
-
90
-
91
-
92
-
93
-
94
-
95
-
96
-
97
-
98
-
99
-
100
-
101
-
102
-
103
-
104
-
105
-
106
-
107
-
108
-
109
-
110
-
111
-
112
-
113
-
114
-
115
-
116
-
117
-
118
-
119
-
120
-
121
-
122
-
123
-
124
-
125
-
126
-
127
-
128
-
129
-
130
-
131
-
132
-
133
-
134
-
135
-
136
-
137
-
138
-
139
-
140
-
141
-
142
-
143
-
144
-
145
-
146
-
147
-
148
-
149
-
150
-
151
-
152
-
153
-
154
-
155
-
156
-
157
-
158
-
159
-
160
-
161
-
162
-
163
-
164
-
165
-
166
-
167
-
168
-
169
-
170
-
171
-
172
-
173
-
174
-
175
-
176
-
177
-
178
-
179
-
180
-
181
-
182
-
183
-
184
-
185
-
186
-
187
-
188
-
189
-
190
-
191
-
192
-
193
-
194
-
195
-
196
-
197
-
198
-
199
-
200
-
201
-
202
-
203
-
204
-
205
-
206
-
207
-
208
-
209
-
210
-
211
-
212
-
213
-
214
-
215
-
216
-
217
-
218
-
219
-
220
-
221
-
222
-
223
-
224
-
225
-
226
-
227
-
 228
228 -
 229
229 -
 230
230 -
 231
231 -
 232
232 -
 233
233 -
 234
234 -
 235
235 -
 236
236 -
 237
237 -
 238
238 -
 239
239 -
 240
240
 |
 |

30
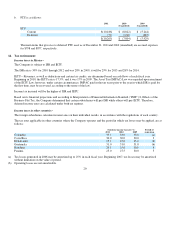
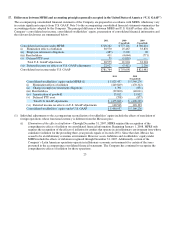
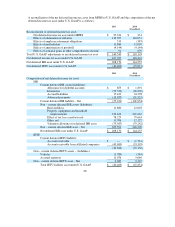
iii. Certain items classified within other revenues in the consolidated statements of operations under MFRS
are presented within other operating income under U.S. GAAP. Such amounts in 2011, 2010 (unaudited)
and 2009 (unaudited) are $9,567, $25,788 and $39,427, res
p
ectivel
y
.
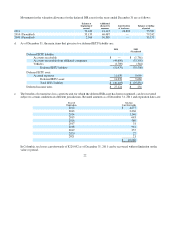
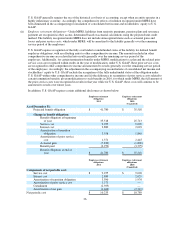
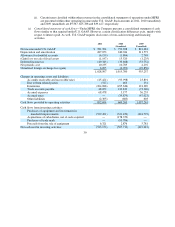
(c) Consolidated statement of cash flows
—
Under MFRS, the Company presents a consolidated statement of cash
flows similar to that required under U.S. GAAP. However, certain classification differences exist, mainly with
respect to interest paid. As well, U.S. GAAP requires disclosures of non-cash investing and financing
activities.
2011 2010 2009
(Unaudited) (Unaudited)
Net income under U.S. GAAP
$781,764
$793,698
$821,481
De
p
reciation and amortization
287,053
240,384
211,573
Allowance for doubtful accounts
(6,150) (1,804)
2,748
(Gain) loss on sale of fixed assets
(1,147) 15,520
(1,235)
Deferred income tax
(49,343)
(33,808)
(53,752)
Net
p
eriodic cost
10,235
10,789
4,292
Unrealized forei
g
n exchan
g
e loss (
g
ain)
6,095
(4,999)
(29,85
0
)
1,028,507
1,019,780
955,257
Chan
g
es in o
p
eratin
g
assets and liabilities:
Accounts receivable and recorvable taxes
(45,421)
(93,998)
23,891
Due to/from related
p
arties
(527)
463
131
Inventories
(204,088)
(495,636)
121,389
Trade accounts
p
a
y
able
48,050
213,819
(73,24
0
)
Accrued ex
p
enses
68,478 5,177
56,255
Accrued taxes
—
(39,879)
(47,023)
Other liabilities
(2,305)
(603)
603
Cash flows
p
rovided b
y
o
p
eratin
g
activities
892,694
609,263
1,037,263
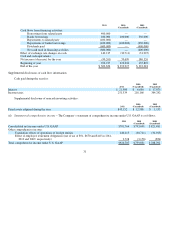
Cash flows from investin
g
activities:
Purchases of equipment and investments in
leasehold im
p
rovements
(529,491)
(321,45
0
)
(424,793)
Ac
q
uisitions of subsidiaries, net of cash ac
q
uired
—
(178,353)
—
Purchases of trade mar
k
—
(10,786)
—
Proceeds from the sale of e
q
ui
p
ment
6,321
2,876
5,781
Net cash used in investin
g
activities
(523,170) (507,713)
(419,012)