Office Depot 2011 Annual Report Download - page 27
Download and view the complete annual report
Please find page 27 of the 2011 Office Depot annual report below. You can navigate through the pages in the report by either clicking on the pages listed below, or by using the keyword search tool below to find specific information within the annual report.-
 1
1 -
2
-
3
-
4
-
5
-
6
-
7
-
8
-
9
-
10
-
11
-
12
-
13
-
14
-
15
-
16
-
 17
17 -
 18
18 -
 19
19 -
 20
20 -
 21
21 -
 22
22 -
 23
23 -
 24
24 -
 25
25 -
 26
26 -
 27
27 -
 28
28 -
 29
29 -
 30
30 -
 31
31 -
 32
32 -
 33
33 -
 34
34 -
 35
35 -
 36
36 -
 37
37 -
38
-
39
-
40
-
41
-
42
-
43
-
44
-
45
-
46
-
47
-
48
-
49
-
50
-
51
-
52
-
53
-
54
-
55
-
56
-
57
-
58
-
59
-
60
-
61
-
62
-
63
-
64
-
65
-
66
-
67
-
68
-
69
-
70
-
71
-
72
-
73
-
74
-
75
-
76
-
77
-
78
-
79
-
80
-
81
-
82
-
83
-
84
-
85
-
86
-
87
-
88
-
89
-
90
-
91
-
92
-
93
-
94
-
95
-
96
-
97
-
98
-
99
-
100
-
101
-
102
-
103
-
104
-
105
-
106
-
107
-
108
-
109
-
110
-
111
-
112
-
113
-
114
-
115
-
116
-
117
-
118
-
119
-
120
-
121
-
122
-
123
-
124
-
125
-
126
-
127
-
128
-
129
-
130
-
131
-
132
-
133
-
134
-
135
-
136
-
137
-
138
-
139
-
140
-
141
-
142
-
143
-
144
-
145
-
146
-
147
-
148
-
149
-
150
-
151
-
152
-
153
-
154
-
155
-
156
-
157
-
158
-
159
-
160
-
161
-
162
-
163
-
164
-
165
-
166
-
167
-
168
-
169
-
170
-
171
-
172
-
173
-
174
-
175
-
176
-
177
-
178
-
179
-
180
-
181
-
182
-
183
-
184
-
185
-
186
-
187
-
188
-
189
-
190
-
191
-
192
-
193
-
194
-
195
-
196
-
197
-
198
-
199
-
200
-
201
-
202
-
203
-
204
-
205
-
206
-
207
-
208
-
209
-
210
-
211
-
212
-
213
-
214
-
215
-
216
-
217
-
218
-
219
-
220
-
221
-
222
-
223
-
224
-
225
-
226
-
227
-
228
-
229
-
230
-
231
-
232
-
233
-
234
-
235
-
236
-
237
-
238
-
239
-
240
 |
 |

followed a strategic review that led to closures of DCs in North America and Europe, closures of stores in North
America and Japan, losses on sale-leaseback transactions that were initiated to enhance our liquidity position, as
well as headcount reductions and other restructuring activities. As noted above, costs associated with that
strategic review were captured and reviewed at the corporate level and were not included in Division results,
consistent with the internal reporting used to manage the business and allocate resources. In addition to severance
costs which usually require cash payment within 60 days of the initial accounting expense recognition, a
significant amount of the Charges in 2009 related to closed store accruals, and to a lesser extent the 2011 store
closures, which will continue to require cash payments over the related lease contract period or until the lease is
terminated. Charges and credits associated with adjusting these accrued lease liabilities can impact future period
results. Also, the ongoing accretion of the discounted accrued liability is reflected in operating expenses at the
corporate level, but is not included in the charges and impairments discussed above. The accretion charge for
2011 and 2010 totaled approximately $12 million and $14 million, respectively.
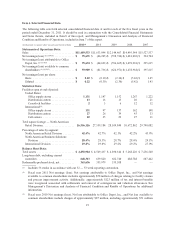
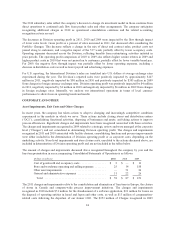
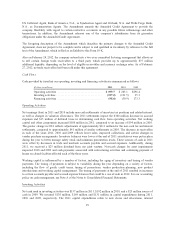
The following table indicates the amount of charges and impairments included in the determination of Division
operating profit and at the corporate level:
(Dollars in million) 2011 2010 2009
North America Retail Division ......................... $ 12 $ — $ —
North America Business Solutions Division ............... — — —
International Division ................................ 31 23 —
Corporate level ..................................... 15 64 253
Total ........................................... $ 58 $ 87 $ 253
Additional charges are anticipated in the International Division during 2012 as activities are implemented and the
accounting recognition criteria are met.
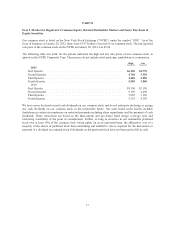
General and Administrative Expenses
Total general and administrative expenses (“G&A”) increased to $689 million in 2011 from $659 million in
2010. The portion of G&A expenses considered directly or closely related to division activity is included in the
measurement of Division operating profit. Other companies may charge more or less G&A expenses and other
costs to their segments, and our results therefore may not be comparable to similarly titled measures used by
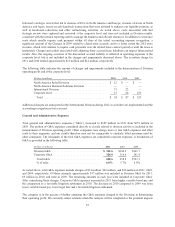
other companies. The remainder of the total G&A expenses are considered corporate expenses. A breakdown of
G&A is provided in the following table:
(Dollars in millions) 2011 2010 2009
Division G&A ................................. $ 362.6 $342.2 $361.7
Corporate G&A ................................ 326.0 316.6 361.4
Total G&A .................................. 688.6 658.8 $723.1
% of sales ................................... 6.0% 5.7% 6.0%
As noted above, total G&A expenses include charges of $31 million, $22 million, and $26 million in 2011, 2010,
and 2009, respectively. Of these amounts, approximately $17 million was included in Division G&A for 2011,
$9 million in 2010, and none in 2009. The remaining amounts in each year were included in Corporate G&A.
After considering these charges, Corporate G&A expenses increased in 2011 from higher variable based pay and
the comparison to a favorable litigation settlement in 2010. The decrease in 2010 compared to 2009 was from
lower variable based pay, lower legal fees and a favorable litigation settlement.
The company is in the process of further assessing the G&A expenses charged to the Divisions in determining
their operating profit. We currently cannot estimate when this analysis will be completed or the potential impacts
25