Office Depot 2011 Annual Report Download - page 142
Download and view the complete annual report
Please find page 142 of the 2011 Office Depot annual report below. You can navigate through the pages in the report by either clicking on the pages listed below, or by using the keyword search tool below to find specific information within the annual report.-
 1
1 -
2
-
3
-
4
-
5
-
6
-
7
-
8
-
9
-
10
-
11
-
12
-
13
-
14
-
15
-
16
-
17
-
18
-
19
-
20
-
21
-
22
-
23
-
24
-
25
-
26
-
27
-
28
-
29
-
30
-
31
-
32
-
33
-
34
-
35
-
36
-
37
-
38
-
39
-
40
-
41
-
42
-
43
-
44
-
45
-
46
-
47
-
48
-
49
-
50
-
51
-
52
-
53
-
54
-
55
-
56
-
57
-
58
-
59
-
60
-
61
-
62
-
63
-
64
-
65
-
66
-
67
-
68
-
69
-
70
-
71
-
72
-
73
-
74
-
75
-
76
-
77
-
78
-
79
-
80
-
81
-
82
-
83
-
84
-
85
-
86
-
87
-
88
-
89
-
90
-
91
-
92
-
93
-
94
-
95
-
96
-
97
-
98
-
99
-
100
-
101
-
102
-
103
-
104
-
105
-
106
-
107
-
108
-
109
-
110
-
111
-
112
-
113
-
114
-
115
-
116
-
117
-
118
-
119
-
120
-
121
-
122
-
123
-
124
-
125
-
126
-
127
-
128
-
129
-
130
-
131
-
 132
132 -
 133
133 -
 134
134 -
 135
135 -
 136
136 -
 137
137 -
 138
138 -
 139
139 -
 140
140 -
 141
141 -
 142
142 -
 143
143 -
 144
144 -
 145
145 -
 146
146 -
 147
147 -
 148
148 -
 149
149 -
 150
150 -
 151
151 -
 152
152 -
153
-
154
-
155
-
156
-
157
-
158
-
159
-
160
-
161
-
162
-
163
-
164
-
165
-
166
-
167
-
168
-
169
-
170
-
171
-
172
-
173
-
174
-
175
-
176
-
177
-
178
-
179
-
180
-
181
-
182
-
183
-
184
-
185
-
186
-
187
-
188
-
189
-
190
-
191
-
192
-
193
-
194
-
195
-
196
-
197
-
198
-
199
-
200
-
201
-
202
-
203
-
204
-
205
-
206
-
207
-
208
-
209
-
210
-
211
-
212
-
213
-
214
-
215
-
216
-
217
-
218
-
219
-
220
-
221
-
222
-
223
-
224
-
225
-
226
-
227
-
228
-
229
-
230
-
231
-
232
-
233
-
234
-
235
-
236
-
237
-
238
-
239
-
240
 |
 |

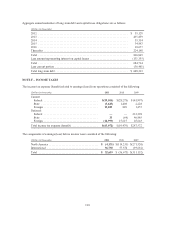
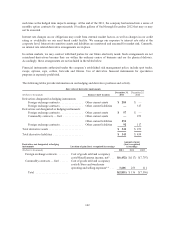
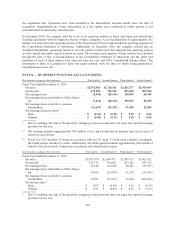
(Dollars in thousands)
Fair Value Measurements
at December 25, 2010
Asset Category Total
Quoted Prices
in Active
Markets for
Identical
Assets
(Level 1)
Significant
Observable
Inputs
(Level 2)
Significant
Unobservable
Inputs
(Level 3)
Cash ..................................... $ — $ — $ — $ —
Equity securities ............................ 95,699 95,699 — —
Debt securities ............................. 36,323 36,323 — —
Total ................................... $ 132,022 $132,022 $ — $ —
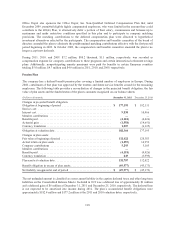
Anticipated benefit payments, at December 31, 2011 exchange rates, are as follows:
(Dollars in thousands)
2012 .................................................................. $ 4,111
2013 .................................................................. 4,232
2014 .................................................................. 4,360
2015 .................................................................. 4,490
2016 .................................................................. 4,626
Next five years .......................................................... 25,292
During January 2012, the company settled an outstanding dispute with the seller of the entity which included this
pension plan. Amounts received from the seller have been contributed to the plan in 2012. See Note R for
additional discussion.
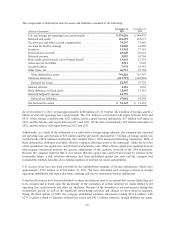
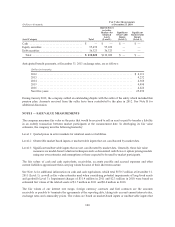
NOTE I — FAIR VALUE MEASUREMENTS
The company measures fair value as the price that would be received to sell an asset or paid to transfer a liability
in an orderly transaction between market participants at the measurement date. In developing its fair value
estimates, the company uses the following hierarchy:
Level 1: Quoted prices in active markets for identical assets or liabilities.
Level 2: Observable market based inputs or unobservable inputs that are corroborated by market data.
Level 3: Significant unobservable inputs that are not corroborated by market data. Generally, these fair value
measures are model-based valuation techniques such as discounted cash flows or option pricing models
using our own estimates and assumptions or those expected to be used by market participants.
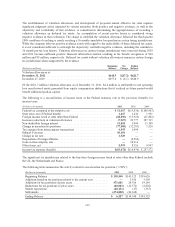
The fair values of cash and cash equivalents, receivables, accounts payable and accrued expenses and other
current liabilities approximate their carrying values because of their short-term nature.
See Note A for additional information on cash and cash equivalents, which total $570.7 million at December 31,
2011 (Level 1), as well as fair value estimates used when considering potential impairments of long-lived assets
and goodwill (Level 3). Impairment charges of $11.4 million in 2011 and $2.3 million in 2010 were based on
estimated fair values of the related assets of $1.7 million in 2011 and $0.4 million in 2010.
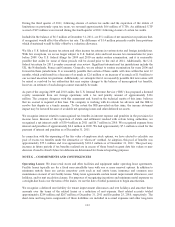
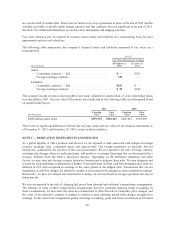
The fair values of our interest rate swaps, foreign currency contracts and fuel contracts are the amounts
receivable or payable to terminate the agreements at the reporting date, taking into account current interest rates,
exchange rates and commodity prices. The values are based on market-based inputs or unobservable inputs that
140