Office Depot 2011 Annual Report Download - page 6
Download and view the complete annual report
Please find page 6 of the 2011 Office Depot annual report below. You can navigate through the pages in the report by either clicking on the pages listed below, or by using the keyword search tool below to find specific information within the annual report.-
 1
1 -
 2
2 -
 3
3 -
 4
4 -
 5
5 -
 6
6 -
 7
7 -
 8
8 -
 9
9 -
 10
10 -
 11
11 -
 12
12 -
 13
13 -
 14
14 -
 15
15 -
 16
16 -
 17
17 -
18
-
19
-
20
-
21
-
22
-
23
-
24
-
25
-
26
-
27
-
28
-
29
-
30
-
31
-
32
-
33
-
34
-
35
-
36
-
37
-
38
-
39
-
40
-
41
-
42
-
43
-
44
-
45
-
46
-
47
-
48
-
49
-
50
-
51
-
52
-
53
-
54
-
55
-
56
-
57
-
58
-
59
-
60
-
61
-
62
-
63
-
64
-
65
-
66
-
67
-
68
-
69
-
70
-
71
-
72
-
73
-
74
-
75
-
76
-
77
-
78
-
79
-
80
-
81
-
82
-
83
-
84
-
85
-
86
-
87
-
88
-
89
-
90
-
91
-
92
-
93
-
94
-
95
-
96
-
97
-
98
-
99
-
100
-
101
-
102
-
103
-
104
-
105
-
106
-
107
-
108
-
109
-
110
-
111
-
112
-
113
-
114
-
115
-
116
-
117
-
118
-
119
-
120
-
121
-
122
-
123
-
124
-
125
-
126
-
127
-
128
-
129
-
130
-
131
-
132
-
133
-
134
-
135
-
136
-
137
-
138
-
139
-
140
-
141
-
142
-
143
-
144
-
145
-
146
-
147
-
148
-
149
-
150
-
151
-
152
-
153
-
154
-
155
-
156
-
157
-
158
-
159
-
160
-
161
-
162
-
163
-
164
-
165
-
166
-
167
-
168
-
169
-
170
-
171
-
172
-
173
-
174
-
175
-
176
-
177
-
178
-
179
-
180
-
181
-
182
-
183
-
184
-
185
-
186
-
187
-
188
-
189
-
190
-
191
-
192
-
193
-
194
-
195
-
196
-
197
-
198
-
199
-
200
-
201
-
202
-
203
-
204
-
205
-
206
-
207
-
208
-
209
-
210
-
211
-
212
-
213
-
214
-
215
-
216
-
217
-
218
-
219
-
220
-
221
-
222
-
223
-
224
-
225
-
226
-
227
-
228
-
229
-
230
-
231
-
232
-
233
-
234
-
235
-
236
-
237
-
238
-
239
-
240
 |
 |

During 2010, we entered into an amended shareholders’ agreement related to our venture in India such that
control and ownership is now equally shared. Accordingly, we deconsolidated the assets and liabilities of this
entity from the 2010 year end balance sheet and now account for this investment under the equity method.
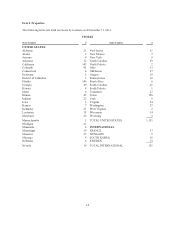
Including company-owned operations, joint ventures, licensing and franchise agreements we sell office products
through 546 retail stores outside the U.S.
International Division store and DC operations are summarized below (includes only wholly-owned and
majority-owned entities):
Office Supply Stores
Open at
Beginning
of Period
Opened/
Acquired
Closed/
Deconsolidated
Open at
End
of Period
2009 ...................................... 162 4 29 137
2010 ...................................... 137 7 47
(1) 97
2011 ...................................... 97 43(2) 9 131
(1) 45 of these stores relate to the deconsolidation of Office Depot Israel.
(2) 40 of these stores relate to the acquisition of an entity in Sweden.
Distribution Centers
Open at
Beginning
of Period
Opened/
Acquired
Closed/
Deconsolidated
Open at
End
of Period
2009 ...................................... 43 1 5 39
2010 ...................................... 39 1 14
(3) 26
2011 ...................................... 26 1 — 27
(3) 10 of these locations relate to the deconsolidation of Office Depot India.
Merchandising
Our merchandising strategy is to meet our customers’ needs by offering a broad selection of nationally branded
office products, as well as our own brand products and services. Our selection of own brand products has
increased in breadth and level of sophistication over time. We currently offer general office supplies, computer
supplies, business machines and related supplies, and office furniture under various labels, including Office
Depot®, Viking Office Products®, Foray®, and Ativa®.
Total company sales by product group were as follows:
2011 2010 2009
Supplies ........................................ 65.1% 65.2% 66.4%
Technology ..................................... 21.9% 22.4% 22.2%
Furniture and other ............................... 13.0% 12.4% 11.4%
100.0% 100.0% 100.0%
Note: Prior year values have been updated to conform to current year presentation.
We classify our products into three categories: (1) supplies, (2) technology, and (3) furniture and other. The
supplies category includes products such as paper, binders, writing instruments, school supplies, and ink and
toner. The technology category includes products such as desktop and laptop computers, monitors, printers,
cables, software, digital cameras, telephones, and wireless communications products. The furniture and other
category includes products such as desks, chairs, luggage, sales in our copy and print centers, and other
miscellaneous items.
4