Office Depot 2011 Annual Report Download - page 128
Download and view the complete annual report
Please find page 128 of the 2011 Office Depot annual report below. You can navigate through the pages in the report by either clicking on the pages listed below, or by using the keyword search tool below to find specific information within the annual report.-
 1
1 -
2
-
3
-
4
-
5
-
6
-
7
-
8
-
9
-
10
-
11
-
12
-
13
-
14
-
15
-
16
-
17
-
18
-
19
-
20
-
21
-
22
-
23
-
24
-
25
-
26
-
27
-
28
-
29
-
30
-
31
-
32
-
33
-
34
-
35
-
36
-
37
-
38
-
39
-
40
-
41
-
42
-
43
-
44
-
45
-
46
-
47
-
48
-
49
-
50
-
51
-
52
-
53
-
54
-
55
-
56
-
57
-
58
-
59
-
60
-
61
-
62
-
63
-
64
-
65
-
66
-
67
-
68
-
69
-
70
-
71
-
72
-
73
-
74
-
75
-
76
-
77
-
78
-
79
-
80
-
81
-
82
-
83
-
84
-
85
-
86
-
87
-
88
-
89
-
90
-
91
-
92
-
93
-
94
-
95
-
96
-
97
-
98
-
99
-
100
-
101
-
102
-
103
-
104
-
105
-
106
-
107
-
108
-
109
-
110
-
111
-
112
-
113
-
114
-
115
-
116
-
117
-
 118
118 -
 119
119 -
 120
120 -
 121
121 -
 122
122 -
 123
123 -
 124
124 -
 125
125 -
 126
126 -
 127
127 -
 128
128 -
 129
129 -
 130
130 -
 131
131 -
 132
132 -
 133
133 -
 134
134 -
 135
135 -
 136
136 -
 137
137 -
 138
138 -
139
-
140
-
141
-
142
-
143
-
144
-
145
-
146
-
147
-
148
-
149
-
150
-
151
-
152
-
153
-
154
-
155
-
156
-
157
-
158
-
159
-
160
-
161
-
162
-
163
-
164
-
165
-
166
-
167
-
168
-
169
-
170
-
171
-
172
-
173
-
174
-
175
-
176
-
177
-
178
-
179
-
180
-
181
-
182
-
183
-
184
-
185
-
186
-
187
-
188
-
189
-
190
-
191
-
192
-
193
-
194
-
195
-
196
-
197
-
198
-
199
-
200
-
201
-
202
-
203
-
204
-
205
-
206
-
207
-
208
-
209
-
210
-
211
-
212
-
213
-
214
-
215
-
216
-
217
-
218
-
219
-
220
-
221
-
222
-
223
-
224
-
225
-
226
-
227
-
228
-
229
-
230
-
231
-
232
-
233
-
234
-
235
-
236
-
237
-
238
-
239
-
240
 |
 |
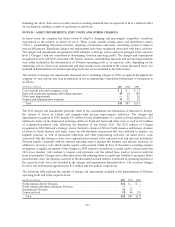
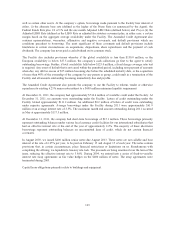
Reconciliations of beginning and ending liability balances associated with exit and restructuring-related costs
that are addressed above are as follows:
(Dollars in millions)
Beginning
Balance
Charges
Incurred
Cash
Payments
Non-cash
Settlements
and
Accretion
Currency
and Other
Adjustments
Ending
Balance
2011
Termination benefits ....................... $ 4 $25 $(17) $— $— $ 12
Accelerated depreciation .................... — 2 — (2) — —
Lease, contract obligations and, other costs ..... 113 26 (59) 12 3 95
Total .................................... $117 $53 $(76) $10 $ 3 $107
2010
Termination benefits ....................... $ 13 $ 6 $(12) $— $ (3) $ 4
Asset impairments and accelerated
depreciation ............................ — 1 — (1) — —
Lease and contract obligations ............... 162 5 (64) 14 (4) 113
Total .................................... $175 $12 $(76) $13 $ (7) $117
Lease accruals on closed facilities reflect the company’s best estimate of its obligations under these long-term
arrangements, net of sublease assumptions, discounted at the company’s estimated unsecured borrowing rate at
the time of each location closure. This accrued liability may be adjusted in future periods as actual sublease
activity is better or worse than estimated. Any such adjustments, as well as accretion of this liability will be
reflected as a component of store and warehouse operating and selling expenses or general and administrative
expenses, depending on the nature of the underlying assets.
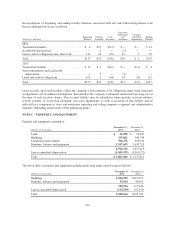
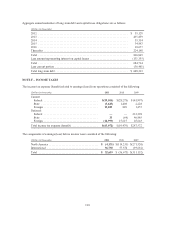
NOTE C – PROPERTY AND EQUIPMENT
Property and equipment consisted of:
(Dollars in thousands)
December 31,
2011
December 25,
2010
Land ................................................... $ 34,258 $ 36,447
Buildings ................................................ 335,862 340,748
Leasehold improvements ................................... 998,736 994,320
Furniture, fixtures and equipment ............................ 1,547,659 1,645,750
2,916,515 3,017,265
Less accumulated depreciation ............................... (1,849,475) (1,860,252)
Total ................................................... $ 1,067,040 $ 1,157,013
The above table of property and equipment includes assets held under capital leases as follows:
(Dollars in thousands)
December 31,
2011
December 25,
2010
Buildings ................................................. $ 266,992 $267,471
Furniture, fixtures and equipment ............................. 53,924 49,969
320,916 317,440
Less accumulated depreciation ................................ (112,250) (92,695)
Total .................................................... $ 208,666 $224,745
126