Office Depot 2011 Annual Report Download - page 32
Download and view the complete annual report
Please find page 32 of the 2011 Office Depot annual report below. You can navigate through the pages in the report by either clicking on the pages listed below, or by using the keyword search tool below to find specific information within the annual report.
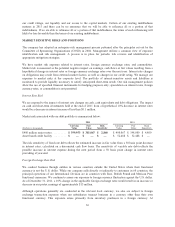
initiatives and various capital projects. The $73 million of acquisition, net of cash acquired was for the
acquisition of an entity in Sweden that occurred during the first quarter of 2011. Approximately $47 million was
placed in a restricted cash escrow account in 2010 and released in 2011 to fund this acquisition. During 2010, we
used approximately $11 million to complete an acquisition. Proceeds from disposition of assets amounted to $8
million in 2011 compared to $35 million in 2010 and $150 million in 2009. Proceeds from the disposition of
assets in 2010 included $25 million from the sale of a data center and $8 million from the sale of two operating
subsidiaries in the International Division. Proceeds from the disposition of assets in 2009 included proceeds of
sale-leaseback transactions of approximately $116 million. In 2009, we also completed the sale of an asset
previously classified as a capital lease, resulting in proceeds of approximately $29 million. We placed $9 million
of restricted cash on deposit in 2011 relating to an advance received on a dispute that was settled in January
2012.
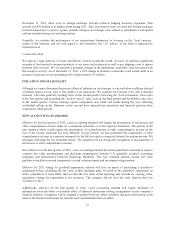
Financing Activities
Net cash used in financing activities totaled $99 million and $31 million in 2011 and 2010, compared to a source
of cash of $173 million in 2009. The use of cash in 2011 included the cash dividends paid on our convertible
preferred stock of approximately $37 million, repayments of long and short term borrowings of $69 million, and
$10 million in fees related to the Amended Credit Agreement. The dividend on our convertible preferred stock
for the fourth quarter of 2011 was paid in-kind in January 2012. The sources of cash in 2011 included proceeds
from issuance of borrowings of $10 million, as well as an advance of $9 million was received relating to a
dispute associated with a prior year acquisition in Europe. A final settlement of this dispute was reached in
January 2012; see Note R of Notes to Consolidated Financial Statements for additional discussion. The use of
cash in 2010 resulted from the cash dividends paid on our convertible preferred stock of approximately $28
million and $22 million to acquire certain noncontrolling interests. The 2010 period included short-term
borrowings under the Facility offset by payments of approximately $30 million. The source of cash in 2009
resulted from our issuance of redeemable preferred stock during the second quarter, partially offset by
repayments of borrowing on our asset based credit facility and capital lease payments. The company has
evaluated, and expects to continue to evaluate, possible refinancings and other transactions. Such transactions
may be material and may involve cash, the company’s securities or the assumption of additional indebtedness.
Off-Balance Sheet Arrangements
As of December 31, 2011, we had no off-balance sheet arrangements other than operating leases which are
included in the table below.
Contractual Obligations
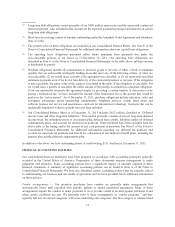
The following table summarizes our contractual cash obligations at December 31, 2011, and the effect such
obligations are expected to have on liquidity and cash flow in future periods:
Payments Due by Period
(Dollars in millions) Total
Less than
1 year 1 - 3 years 4 - 5 years
After 5
years
Contractual Obligations
Long-term debt obligations (1) ..................... $ 479.6 $ 28.8 $ 429.9 $ 4.3 $ 16.6
Short-term borrowings and other (2) ................. 15.1 15.1 — — —
Capital lease obligations (3) ........................ 489.4 54.9 95.4 86.0 253.1
Operating lease obligations (4) ..................... 2,327.0 488.1 782.3 490.8 565.8
Purchase obligations (5) ........................... 217.4 144.9 65.1 7.4 —
Other liabilities (6) ............................... — — — — —
Total contractual cash obligations .................... $3,528.5 $ 731.8 $1,372.7 $ 588.5 $835.5
30


