Office Depot 2011 Annual Report Download - page 129
Download and view the complete annual report
Please find page 129 of the 2011 Office Depot annual report below. You can navigate through the pages in the report by either clicking on the pages listed below, or by using the keyword search tool below to find specific information within the annual report.-
 1
1 -
2
-
3
-
4
-
5
-
6
-
7
-
8
-
9
-
10
-
11
-
12
-
13
-
14
-
15
-
16
-
17
-
18
-
19
-
20
-
21
-
22
-
23
-
24
-
25
-
26
-
27
-
28
-
29
-
30
-
31
-
32
-
33
-
34
-
35
-
36
-
37
-
38
-
39
-
40
-
41
-
42
-
43
-
44
-
45
-
46
-
47
-
48
-
49
-
50
-
51
-
52
-
53
-
54
-
55
-
56
-
57
-
58
-
59
-
60
-
61
-
62
-
63
-
64
-
65
-
66
-
67
-
68
-
69
-
70
-
71
-
72
-
73
-
74
-
75
-
76
-
77
-
78
-
79
-
80
-
81
-
82
-
83
-
84
-
85
-
86
-
87
-
88
-
89
-
90
-
91
-
92
-
93
-
94
-
95
-
96
-
97
-
98
-
99
-
100
-
101
-
102
-
103
-
104
-
105
-
106
-
107
-
108
-
109
-
110
-
111
-
112
-
113
-
114
-
115
-
116
-
117
-
118
-
 119
119 -
 120
120 -
 121
121 -
 122
122 -
 123
123 -
 124
124 -
 125
125 -
 126
126 -
 127
127 -
 128
128 -
 129
129 -
 130
130 -
 131
131 -
 132
132 -
 133
133 -
 134
134 -
 135
135 -
 136
136 -
 137
137 -
 138
138 -
 139
139 -
140
-
141
-
142
-
143
-
144
-
145
-
146
-
147
-
148
-
149
-
150
-
151
-
152
-
153
-
154
-
155
-
156
-
157
-
158
-
159
-
160
-
161
-
162
-
163
-
164
-
165
-
166
-
167
-
168
-
169
-
170
-
171
-
172
-
173
-
174
-
175
-
176
-
177
-
178
-
179
-
180
-
181
-
182
-
183
-
184
-
185
-
186
-
187
-
188
-
189
-
190
-
191
-
192
-
193
-
194
-
195
-
196
-
197
-
198
-
199
-
200
-
201
-
202
-
203
-
204
-
205
-
206
-
207
-
208
-
209
-
210
-
211
-
212
-
213
-
214
-
215
-
216
-
217
-
218
-
219
-
220
-
221
-
222
-
223
-
224
-
225
-
226
-
227
-
228
-
229
-
230
-
231
-
232
-
233
-
234
-
235
-
236
-
237
-
238
-
239
-
240
 |
 |
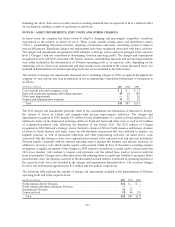
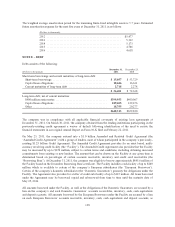
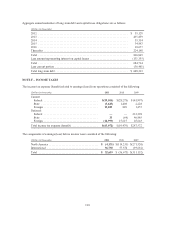
NOTE D – GOODWILL AND OTHER INTANGIBLE ASSETS
Goodwill
The components of goodwill by segment are provided in the following table:
(Dollars in thousands)
North
American
Retail
Division
North
American
Business
Solutions
Division
International
Division Total
Balance as of December 26, 2009
Goodwill ........................................ $1,842 $ 367,790 $ 863,134 $ 1,232,766
Accumulated impairment losses ..................... (1,842) (348,359) (863,134) (1,213,335)
— 19,431 — 19,431
2010 Changes — — — —
Balance as of December 25, 2010 ......................
Goodwill ........................................ 1,842 367,790 863,134 $ 1,232,766
Accumulated impairment losses ..................... (1,842) (348,359) (863,134) (1,213,335)
— 19,431 — 19,431
2011 Changes
Balance as of December 31, 2011
Goodwill ...................................... 1,842 367,790 863,134 $ 1,232,766
Accumulated impairment losses ................... (1,842) (348,359) (863,134) (1,213,335)
Goodwill acquired during the year ................. — — 45,805 45,805
Foreign currency rate impact ...................... (3,337) (3,337)
$ — $ 19,431 $ 42,468 $ 61,899
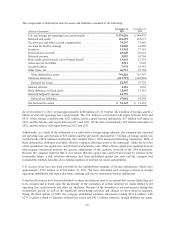
Other Intangible Assets
Indefinite-lived intangible assets related to acquired trade names were $5.5 million and $5.6 million, at
December 31, 2011 and December 25, 2010, respectively, and are included in other intangible assets in the
Consolidated Balance Sheets. Indefinite-lived intangibles are not subject to amortization. Instead, they are tested
for impairment at least annually. The change in the balance during 2011 resulted from changes in foreign
currency rates.
Amortizing intangible assets, which are included in other intangible assets in the Consolidated Balance Sheets,
include the following:
December 31, 2011 December 25, 2010
(Dollars in thousands)
Gross
Carrying Value
Accumulated
Amortization
Gross
Carrying Value
Accumulated
Amortization
Customer lists .............................. $ 43,972 $ (16,174) $ 28,000 $ (11,773)
Other ..................................... 5,868 (3,987) 2,600 (2,600)
Total ..................................... $ 49,840 $ (20,161) $30,600 $ (14,373)
We review our amortizing intangible assets at least annually to determine whether events and circumstances
warrant a revision to the remaining period of amortization.
Amortization of intangible assets was $5.2 million in 2011, $2.9 million in 2010, and $3.1 million in 2009 (at
average foreign currency exchange rates).
127