Office Depot 2011 Annual Report Download - page 138
Download and view the complete annual report
Please find page 138 of the 2011 Office Depot annual report below. You can navigate through the pages in the report by either clicking on the pages listed below, or by using the keyword search tool below to find specific information within the annual report.-
 1
1 -
2
-
3
-
4
-
5
-
6
-
7
-
8
-
9
-
10
-
11
-
12
-
13
-
14
-
15
-
16
-
17
-
18
-
19
-
20
-
21
-
22
-
23
-
24
-
25
-
26
-
27
-
28
-
29
-
30
-
31
-
32
-
33
-
34
-
35
-
36
-
37
-
38
-
39
-
40
-
41
-
42
-
43
-
44
-
45
-
46
-
47
-
48
-
49
-
50
-
51
-
52
-
53
-
54
-
55
-
56
-
57
-
58
-
59
-
60
-
61
-
62
-
63
-
64
-
65
-
66
-
67
-
68
-
69
-
70
-
71
-
72
-
73
-
74
-
75
-
76
-
77
-
78
-
79
-
80
-
81
-
82
-
83
-
84
-
85
-
86
-
87
-
88
-
89
-
90
-
91
-
92
-
93
-
94
-
95
-
96
-
97
-
98
-
99
-
100
-
101
-
102
-
103
-
104
-
105
-
106
-
107
-
108
-
109
-
110
-
111
-
112
-
113
-
114
-
115
-
116
-
117
-
118
-
119
-
120
-
121
-
122
-
123
-
124
-
125
-
126
-
127
-
 128
128 -
 129
129 -
 130
130 -
 131
131 -
 132
132 -
 133
133 -
 134
134 -
 135
135 -
 136
136 -
 137
137 -
 138
138 -
 139
139 -
 140
140 -
 141
141 -
 142
142 -
 143
143 -
 144
144 -
 145
145 -
 146
146 -
 147
147 -
 148
148 -
149
-
150
-
151
-
152
-
153
-
154
-
155
-
156
-
157
-
158
-
159
-
160
-
161
-
162
-
163
-
164
-
165
-
166
-
167
-
168
-
169
-
170
-
171
-
172
-
173
-
174
-
175
-
176
-
177
-
178
-
179
-
180
-
181
-
182
-
183
-
184
-
185
-
186
-
187
-
188
-
189
-
190
-
191
-
192
-
193
-
194
-
195
-
196
-
197
-
198
-
199
-
200
-
201
-
202
-
203
-
204
-
205
-
206
-
207
-
208
-
209
-
210
-
211
-
212
-
213
-
214
-
215
-
216
-
217
-
218
-
219
-
220
-
221
-
222
-
223
-
224
-
225
-
226
-
227
-
228
-
229
-
230
-
231
-
232
-
233
-
234
-
235
-
236
-
237
-
238
-
239
-
240
 |
 |

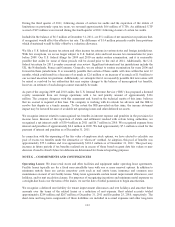
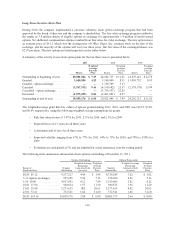
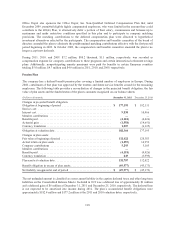
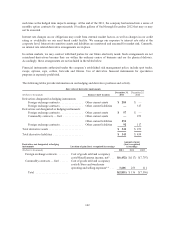
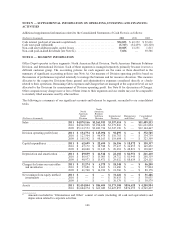
Long-Term Incentive Stock Plan
During 2010, the company implemented a one-time voluntary stock option exchange program that had been
approved by the board of directors and the company’s shareholders. The fair value exchange program resulted in
the tender of 3.8 million shares of eligible options in exchange for approximately 1.4 million of newly-issued
options. No additional compensation expense resulted from this value-for-value exchange. The new options have
an exercise price of $5.13, which was the closing price of Office Depot, Inc. common stock on the date of the
exchange, and the majority of the options will vest over three years. The fair value of the exchanged shares was
$2.97 per share. The new options are listed separately in the tables below.
A summary of the activity in our stock option plans for the last three years is presented below.
2011 2010 2009
Shares
Weighted
Average
Exercise
Price Shares
Weighted
Average
Exercise
Price Shares
Weighted
Average
Exercise
Price
Outstanding at beginning of year ...... 20,021,044 $ 7.49 24,202,715 $ 11.81 14,479,141 $ 22.78
Granted .......................... 3,680,850 4.53 5,140,900 8.11 11,901,752 0.93
Granted – option exchange ........... ——1,350,709 5.13 — —
Canceled ......................... (3,567,513) 9.46 (4,510,682) 21.57 (2,178,178) 15.99
Cancelled – option exchange .......... ——(3,739,557) 22.85 — —
Exercised ......................... (1,075,205) 0.86 (2,423,041) 0.95 — —
Outstanding at end of year ........... 19,059,176 $ 6.90 20,021,044 $ 7.49 24,202,715 $ 11.81
The weighted-average grant date fair values of options granted during 2011, 2010, and 2009 were $2.25, $3.89,
and $0.69, respectively, using the following weighted average assumptions for grants:
• Risk-free interest rates of 1.97% for 2011, 2.3% for 2010, and 2.1% for 2009
• Expected lives of 4.5 years for all three years
• A dividend yield of zero for all three years
• Expected volatility ranging from 67% to 77% for 2011, 64% to 73% for 2010, and 70% to 118% for
2009
• Forfeitures are anticipated at 5% and are adjusted for actual experience over the vesting period
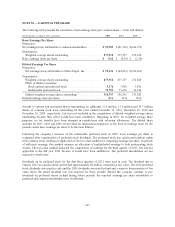
The following table summarizes information about options outstanding at December 31, 2011.
Options Outstanding Options Exercisable
Range of
Exercise Prices
Number
Outstanding
Weighted Average
Remaining
Contractual Life
(in years)
Weighted
Average
Exercise
Price
Number
Exercisable
Weighted Average
Remaining
Contractual Life
(in years)
Weighted
Average
Exercise
Price
$0.85 $5.12 .............. 9,537,217 4.49 $ 1.94 4,319,249 3.62 $ 1.02
5.13 (option exchange) ...... 995,256 5.04 5.13 374,020 4.56 5.13
5.14 10.00 ............... 4,917,893 4.12 7.80 2,519,605 2.81 8.12
10.01 15.00 .............. 960,634 1.97 11.30 940,525 1.96 11.29
15.01 25.00 .............. 2,275,635 .082 20.63 2,275,635 0.82 20.63
25.01 33.61 .............. 372,541 1.66 31.60 372,541 1.66 31.60
$0.85 $33.61 ............. 19,059,176 3.80 $ 6.90 10,801,575 2.66 $ 8.90
136