Office Depot 2011 Annual Report Download - page 54
Download and view the complete annual report
Please find page 54 of the 2011 Office Depot annual report below. You can navigate through the pages in the report by either clicking on the pages listed below, or by using the keyword search tool below to find specific information within the annual report.-
 1
1 -
2
-
3
-
4
-
5
-
6
-
7
-
8
-
9
-
10
-
11
-
12
-
13
-
14
-
15
-
16
-
17
-
18
-
19
-
20
-
21
-
22
-
23
-
24
-
25
-
26
-
27
-
28
-
29
-
30
-
31
-
32
-
33
-
34
-
35
-
36
-
37
-
38
-
39
-
40
-
41
-
42
-
43
-
 44
44 -
 45
45 -
 46
46 -
 47
47 -
 48
48 -
 49
49 -
 50
50 -
 51
51 -
 52
52 -
 53
53 -
 54
54 -
 55
55 -
 56
56 -
 57
57 -
 58
58 -
 59
59 -
 60
60 -
 61
61 -
 62
62 -
 63
63 -
 64
64 -
65
-
66
-
67
-
68
-
69
-
70
-
71
-
72
-
73
-
74
-
75
-
76
-
77
-
78
-
79
-
80
-
81
-
82
-
83
-
84
-
85
-
86
-
87
-
88
-
89
-
90
-
91
-
92
-
93
-
94
-
95
-
96
-
97
-
98
-
99
-
100
-
101
-
102
-
103
-
104
-
105
-
106
-
107
-
108
-
109
-
110
-
111
-
112
-
113
-
114
-
115
-
116
-
117
-
118
-
119
-
120
-
121
-
122
-
123
-
124
-
125
-
126
-
127
-
128
-
129
-
130
-
131
-
132
-
133
-
134
-
135
-
136
-
137
-
138
-
139
-
140
-
141
-
142
-
143
-
144
-
145
-
146
-
147
-
148
-
149
-
150
-
151
-
152
-
153
-
154
-
155
-
156
-
157
-
158
-
159
-
160
-
161
-
162
-
163
-
164
-
165
-
166
-
167
-
168
-
169
-
170
-
171
-
172
-
173
-
174
-
175
-
176
-
177
-
178
-
179
-
180
-
181
-
182
-
183
-
184
-
185
-
186
-
187
-
188
-
189
-
190
-
191
-
192
-
193
-
194
-
195
-
196
-
197
-
198
-
199
-
200
-
201
-
202
-
203
-
204
-
205
-
206
-
207
-
208
-
209
-
210
-
211
-
212
-
213
-
214
-
215
-
216
-
217
-
218
-
219
-
220
-
221
-
222
-
223
-
224
-
225
-
226
-
227
-
228
-
229
-
230
-
231
-
232
-
233
-
234
-
235
-
236
-
237
-
238
-
239
-
240
 |
 |

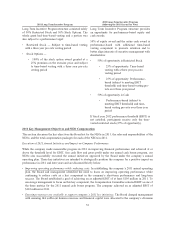
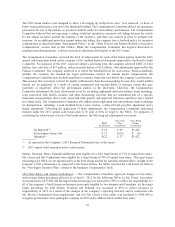
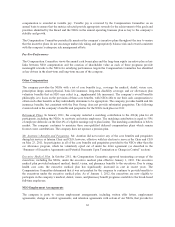
2011 Long-Term Incentive Program
2012 Long-Term Incentive Program
(following the 2011 Say on Pay Vote)
Long Term Incentive Program structure consisted solely
of 50% Restricted Stock and 50% Stock Options. The
whole grant had time-based vesting and a portion was
also subject to a performance target:
• Restricted Stock — Subject to time-based vesting
with a three year pro-rata vesting period
• Stock Options —
• 100% of the stock option award granted at a
25% premium on the exercise price and subject
to time-based vesting with a three year pro-rata
vesting period
Long Term Incentive Program structure provides
an opportunity for performance-based equity and
cash awards.
50% of equity award and the entire cash award is
performance-based with additional time-based
vesting component to promote retention and to
better align interests of executive management with
shareholders:
• 50% of opportunity is Restricted Stock
• 25% of opportunity: Time-based
vesting with a three year pro-rata
vesting period
• 25% of opportunity: Performance-
based (subject to meeting EBIT
threshold) and time-based vesting pro-
rata over three year period
• 50% of opportunity is Cash
• Performance-based (subject to
meeting EBIT threshold) and time-
based vesting pro-rata over three year
period
If fiscal year 2012 performance threshold (EBIT) is
not satisfied, participants receive only the time-
vested restricted stock (25% of opportunity).
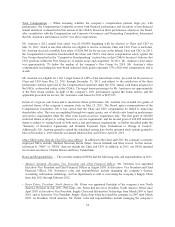
2011 Key Management Objectives and NEO Compensation
This section discusses the key objectives the Board set for the NEOs in 2011, the roles and responsibilities of the
NEOs, and the total compensation packages for each of the NEOs in 2011.
Execution of 2011 Annual Initiatives and Impact on Company Performance
While the company made measurable progress in 2011 in improving financial performance and achieved at or
above the threshold level for EBIT, free cash flow and gross profit under our annual cash bonus program, our
NEOs also successfully executed the annual initiatives approved by the Board under the company’s annual
operating plan. These key initiatives are intended to strategically position the company for a positive impact on
performance in 2011 and later years and are discussed briefly below:
•Improving operating performance while reducing costs. In establishing the company’s 2011 annual operating
plan, the Board and management identified the need to focus on improving operating performance while
continuing to reduce costs as a key component in the company’s short-term performance and long-term
success. The Board established a goal of achieving an as adjusted EBIT of at least $105 million in 2011. To
encourage management to focus on this key component, the Compensation Committee selected EBIT as one of
the three metrics for the 2011 annual cash bonus program. The company achieved an as adjusted EBIT of
$122 million in 2011.
•Ensuring resources are available to support company’s 2011 key initiatives. The Board charged management
with ensuring that sufficient human resources and financial capital were allocated to the company’s divisions
52