Office Depot 2011 Annual Report Download - page 68
Download and view the complete annual report
Please find page 68 of the 2011 Office Depot annual report below. You can navigate through the pages in the report by either clicking on the pages listed below, or by using the keyword search tool below to find specific information within the annual report.-
 1
1 -
 2
2 -
 3
3 -
 4
4 -
 5
5 -
 6
6 -
 7
7 -
 8
8 -
 9
9 -
 10
10 -
 11
11 -
 12
12 -
 13
13 -
 14
14 -
 15
15 -
 16
16 -
 17
17 -
 18
18 -
 19
19 -
 20
20 -
 21
21 -
 22
22 -
 23
23 -
 24
24 -
 25
25 -
 26
26 -
 27
27 -
 28
28 -
 29
29 -
 30
30 -
 31
31 -
 32
32 -
 33
33 -
 34
34 -
 35
35 -
 36
36 -
 37
37 -
 38
38 -
 39
39 -
 40
40 -
 41
41 -
 42
42 -
 43
43 -
 44
44 -
 45
45 -
 46
46 -
 47
47 -
 48
48 -
 49
49 -
 50
50 -
 51
51 -
 52
52 -
 53
53 -
 54
54 -
 55
55 -
 56
56 -
 57
57 -
 58
58 -
 59
59 -
 60
60 -
 61
61 -
 62
62 -
 63
63 -
 64
64 -
 65
65 -
 66
66 -
 67
67 -
 68
68 -
 69
69 -
 70
70 -
 71
71 -
 72
72 -
 73
73 -
 74
74 -
 75
75 -
 76
76 -
 77
77 -
 78
78 -
 79
79 -
 80
80 -
 81
81 -
 82
82 -
 83
83 -
 84
84 -
 85
85 -
 86
86 -
 87
87 -
 88
88 -
 89
89 -
 90
90 -
 91
91 -
 92
92 -
 93
93 -
 94
94 -
 95
95 -
 96
96 -
 97
97 -
 98
98 -
 99
99 -
 100
100 -
 101
101 -
 102
102 -
 103
103 -
 104
104 -
 105
105 -
 106
106 -
 107
107 -
 108
108 -
 109
109 -
 110
110 -
 111
111 -
 112
112 -
 113
113 -
 114
114 -
 115
115 -
 116
116 -
 117
117 -
 118
118 -
 119
119 -
 120
120 -
 121
121 -
 122
122 -
 123
123 -
 124
124 -
 125
125 -
 126
126 -
 127
127 -
 128
128 -
 129
129 -
 130
130 -
 131
131 -
 132
132 -
 133
133 -
 134
134 -
 135
135 -
 136
136 -
 137
137 -
 138
138 -
 139
139 -
 140
140 -
 141
141 -
 142
142 -
 143
143 -
 144
144 -
 145
145 -
 146
146 -
 147
147 -
 148
148 -
 149
149 -
 150
150 -
 151
151 -
 152
152 -
 153
153 -
 154
154 -
 155
155 -
 156
156 -
 157
157 -
 158
158 -
 159
159 -
 160
160 -
 161
161 -
 162
162 -
 163
163 -
 164
164 -
 165
165 -
 166
166 -
 167
167 -
 168
168 -
 169
169 -
 170
170 -
 171
171 -
 172
172 -
 173
173 -
 174
174 -
 175
175 -
 176
176 -
 177
177 -
 178
178 -
 179
179 -
 180
180 -
 181
181 -
 182
182 -
 183
183 -
 184
184 -
 185
185 -
 186
186 -
 187
187 -
 188
188 -
 189
189 -
 190
190 -
 191
191 -
 192
192 -
 193
193 -
 194
194 -
 195
195 -
 196
196 -
 197
197 -
 198
198 -
 199
199 -
 200
200 -
 201
201 -
 202
202 -
 203
203 -
 204
204 -
 205
205 -
 206
206 -
 207
207 -
 208
208 -
 209
209 -
 210
210 -
 211
211 -
 212
212 -
 213
213 -
 214
214 -
 215
215 -
 216
216 -
 217
217 -
 218
218 -
 219
219 -
 220
220 -
 221
221 -
 222
222 -
 223
223 -
 224
224 -
 225
225 -
 226
226 -
 227
227 -
 228
228 -
 229
229 -
 230
230 -
 231
231 -
 232
232 -
 233
233 -
 234
234 -
 235
235 -
 236
236 -
 237
237 -
 238
238 -
 239
239 -
 240
240
 |
 |

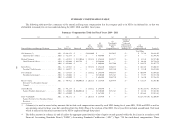
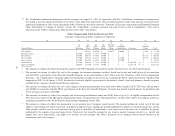
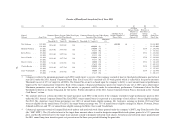
SUMMARY COMPENSATION TABLE
The following table provides a summary of the annual and long-term compensation that the company paid to its NEOs (or deferred for, or that was
attributable to/earned) for services rendered during the 2009, 2010, and 2011 fiscal years.
Summary Compensation Table for Fiscal Years 2009 - 2011
(a) (b) (c) (d) (e) (f) (g) (h) (i) (j)
Named Officers and Principal Positions Year
(1)
Salary ($) Bonus ($)
(2)
Stock
Awards ($)
(2)
Option
Awards
($)
(3)
Non-Equity
Incentive
Plan
Compensation ($)
Change in
Pension
Value and
NQ Deferred
Compensation
Earnings ($)
(4)
All Other
Compensation ($) Total ($)
Total Other
Neil Austrian (5)
Chief Executive Officer .................
2011 $1,646,154 $ — $4,284,000 $ — $815,015 $— $ 71,766 $6,816,935
2010 $ 415,385 $ — $ — $ 984,400 $ — $— $ — $1,399,785
Michael Newman
Chief Financial Officer ..................
2011 $ 637,019 $ 937,500 (6) $ 355,832 $ 294,840 $410,877 $— $ 81,134 $2,717,202
2010 $ 625,000 $ 468,750 $ — $1,580,200 $ — $— $ 40,924 $2,714,874
2009 $ 625,000 $ — $ — $ 200,400 $437,500 $— $ 164,875 $1,427,775
Kevin Peters
President, North America ................
2011 $ 637,019 $ — $ 355,832 $ 294,840 $410,877 $— $ 101,769 $1,800,337
2010 $ 568,077 $ — $ — $1,802,447 $247,380 $— $ 55,120 $2,673,024
Steve Schmidt
President, International ..................
2011 $ 637,019 $ — $ 355,832 $ 294,840 $410,877 $— $ 106,097 $1,804,665
2010 $ 625,000 $ — $ — $1,580,200 $276,563 $— $ 53,957 $2,535,720
2009 $ 625,000 $ — $ — $ 606,200 $468,750 $— $ 36,944 $1,736,894
Elisa D. Garcia
Executive Vice President, General
Counsel ..............................
2011 $ 448,462 $ 500,000 (7) $ 203,333 $ 168,480 $269,974 $— $ 115,157 $1,705,406
Charles Brown
Former President, International ...........
2011 $ 471,154 $ — $ 355,832 $ 294,840 $ — $— $3,471,351 (9) $4,593,177
2010 $ 625,000 $1,000,000 (8) $ — $1,580,200 $276,563 $— $ 44,543 $3,526,306
2009 $ 625,000 $ — $ — $ 267,200 $ — $— $ 653,663 $1,545,863
Daisy Vanderlinde
Former Executive Vice President, Human
Resources ............................
2011 $ 301,231 $ — $ 203,333 $ 168,480 $ — $— $1,627,763 (10) $2,300,807
(1) Column (c) is used to record salary amounts that include cash compensation earned by each NEO during fiscal years 2011, 2010 and 2009 as well as
any amounts earned in those years but contributed into the 401(k) Plan at the election of the NEO. Fiscal year 2011 included an additional 53rd week
which is reflected in the salary amounts for the NEOs employed though that period.
(2) The dollar amounts in columns (e) and (f) reflect the aggregate grant date fair value of equity awards granted within the fiscal year in accordance with
Financial Accounting Standards Board (“FASB”) Accounting Standards Codification (“ASC”) Topic 718 for stock-based compensation. These
66
