Office Depot 2011 Annual Report Download - page 141
Download and view the complete annual report
Please find page 141 of the 2011 Office Depot annual report below. You can navigate through the pages in the report by either clicking on the pages listed below, or by using the keyword search tool below to find specific information within the annual report.-
 1
1 -
2
-
3
-
4
-
5
-
6
-
7
-
8
-
9
-
10
-
11
-
12
-
13
-
14
-
15
-
16
-
17
-
18
-
19
-
20
-
21
-
22
-
23
-
24
-
25
-
26
-
27
-
28
-
29
-
30
-
31
-
32
-
33
-
34
-
35
-
36
-
37
-
38
-
39
-
40
-
41
-
42
-
43
-
44
-
45
-
46
-
47
-
48
-
49
-
50
-
51
-
52
-
53
-
54
-
55
-
56
-
57
-
58
-
59
-
60
-
61
-
62
-
63
-
64
-
65
-
66
-
67
-
68
-
69
-
70
-
71
-
72
-
73
-
74
-
75
-
76
-
77
-
78
-
79
-
80
-
81
-
82
-
83
-
84
-
85
-
86
-
87
-
88
-
89
-
90
-
91
-
92
-
93
-
94
-
95
-
96
-
97
-
98
-
99
-
100
-
101
-
102
-
103
-
104
-
105
-
106
-
107
-
108
-
109
-
110
-
111
-
112
-
113
-
114
-
115
-
116
-
117
-
118
-
119
-
120
-
121
-
122
-
123
-
124
-
125
-
126
-
127
-
128
-
129
-
130
-
 131
131 -
 132
132 -
 133
133 -
 134
134 -
 135
135 -
 136
136 -
 137
137 -
 138
138 -
 139
139 -
 140
140 -
 141
141 -
 142
142 -
 143
143 -
 144
144 -
 145
145 -
 146
146 -
 147
147 -
 148
148 -
 149
149 -
 150
150 -
 151
151 -
152
-
153
-
154
-
155
-
156
-
157
-
158
-
159
-
160
-
161
-
162
-
163
-
164
-
165
-
166
-
167
-
168
-
169
-
170
-
171
-
172
-
173
-
174
-
175
-
176
-
177
-
178
-
179
-
180
-
181
-
182
-
183
-
184
-
185
-
186
-
187
-
188
-
189
-
190
-
191
-
192
-
193
-
194
-
195
-
196
-
197
-
198
-
199
-
200
-
201
-
202
-
203
-
204
-
205
-
206
-
207
-
208
-
209
-
210
-
211
-
212
-
213
-
214
-
215
-
216
-
217
-
218
-
219
-
220
-
221
-
222
-
223
-
224
-
225
-
226
-
227
-
228
-
229
-
230
-
231
-
232
-
233
-
234
-
235
-
236
-
237
-
238
-
239
-
240
 |
 |

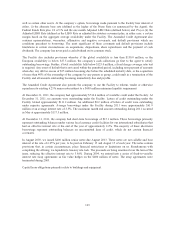
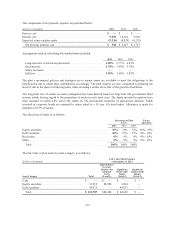
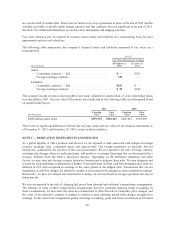
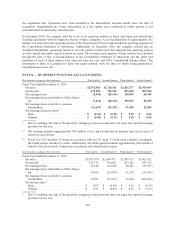
The components of net periodic expense are presented below:
(Dollars in thousands) 2011 2010 2009
Service cost ............................................... $—$—$—
Interest cost ............................................... 9,838 10,466 9,006
Expected return on plan assets ................................ (9,336) (8,039) (6,291)
Net periodic pension cost .................................. $ 502 $ 2,427 $ 2,715
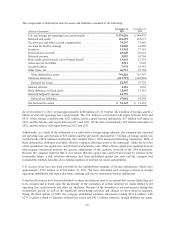
Assumptions used in calculating the funded status included:
2011 2010 2009
Long-term rate of return on plan assets ....................... 6.00% 6.77% 6.89%
Discount rate ........................................... 4.70% 5.40% 5.70%
Salary increases ......................................... ———
Inflation ............................................... 3.00% 3.40% 3.80%
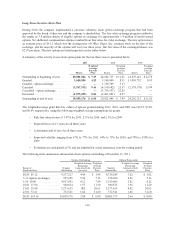
The plan’s investment policies and strategies are to ensure assets are available to meet the obligations to the
beneficiaries and to adjust plan contributions accordingly. The plan trustees are also committed to reducing the
level of risk in the plan over the long term, while retaining a return above that of the growth of liabilities.
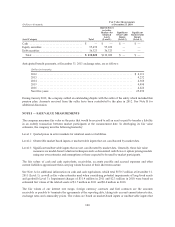
The long-term rate of return on assets assumption has been derived based on long-term UK government fixed
income yields, having regard to the proportion of assets in each asset class. The funds invested in equities have
been assumed to return 4.0% above the return on UK government securities of appropriate duration. Funds
invested in corporate bonds are assumed to return equal to a 15 year AA bond index. Allowance is made for
expenses of 0.5% of assets.
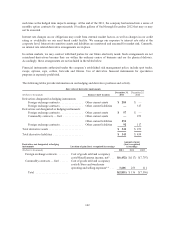
The allocation of assets is as follows:
Percentage of Plan
Assets
Target
Allocation
2011 2010 2009
Equity securities .............................................. 70% 73% 71% 60% - 95%
Debt securities ............................................... 30% 27% 27% 0% - 30%
Real estate ................................................... 0% 0% 0% 0% - 10%
Other ....................................................... 0% 0% 2% 0% - 10%
Total ..................................................... 100% 100% 100%
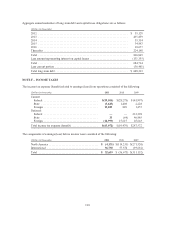
The fair value of plan assets by asset category is as follows:
(Dollars in thousands)
Fair Value Measurements
at December 31, 2011
Asset Category Total
Quoted Prices
in Active
Markets for
Identical
Assets
(Level 1)
Significant
Observable
Inputs
(Level 2)
Significant
Unobservable
Inputs
(Level 3)
Cash ..................................... $ — $ — $ — $ —
Equity securities ............................ 91,912 88,088 3,824 —
Debt securities ............................. 40,875 — 40,875 —
Total ................................... $ 132,787 $88,088 $ 44,699 $ —
139