Office Depot 2011 Annual Report Download - page 25
Download and view the complete annual report
Please find page 25 of the 2011 Office Depot annual report below. You can navigate through the pages in the report by either clicking on the pages listed below, or by using the keyword search tool below to find specific information within the annual report.
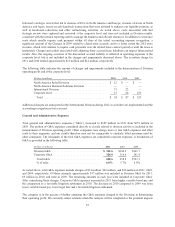
in total, both the number of customer transactions and the average order value per transaction were lower in 2011
and 2010, in part reflecting reductions in promotional activity. During 2011, through alternative non-exclusive
purchasing arrangements, the Division retained approximately 87% of the revenue from customers formerly
associated with a legacy public sector purchasing cooperative. This retention rate is inclusive of declines due to
public sector spending and budget constraints, which impacted these customers as well as our other public sector
customers. Sales in the contract channel, other than to customers buying under these purchasing arrangements,
were positive for 2011. Sales to small-to medium-sized businesses and sales to large national accounts increased
during 2011. On a product category basis in 2011, sales of cleaning and break room products and certain office
supplies increased while ink and toner, furniture, paper and other office supply categories decreased. In 2010, the
Division experienced weakness in durables such as furniture, technology and peripherals, as customers delayed
their purchases of these products in favor of consumables like paper, ink and toner.
Division operating profit totaled $145 million in 2011, $97 million in 2010, and $98 million in 2009. The 2011
increase in Division operating profit reflects gross margin benefits from reduced promotions, the impact of a
change in the mix of product sales to the direct channel, lower operating expenses, a change of mix of customers
in the contract channel, and positive impacts from our margin improvement initiatives. Lower selling,
distribution and advertising expenses were incurred in 2011 compared to 2010. Many of these operating expense
reductions reflect initiatives put in place in prior periods to improve efficiency and productivity. Also, fiscal year
2011 included benefits discrete to the period from removing recourse provisions and changing terms and
conditions in the Office Depot private label credit card program and adjustments relating to customer incentives.
Variable based pay linked to performance was higher in 2011. The impact of the 53rd week was relatively neutral
to the Division’s overall operating profit for 2011. The 2010 decrease in operating profit was partially offset by
higher gross margins from a shift in the mix of customers, some pricing improvements and product mix.
Increased advertising expenses during 2010 were offset by initiatives to reduce the Division’s cost structure and
lower variable pay for the period. The flow through impact of lower sales adversely affected all periods, with the
greatest impact in 2009.
INTERNATIONAL DIVISION
(Dollars in millions) 2011 2010 2009
Sales .................................... $ 3,357.4 $ 3,379.8 $ 3,547.2
% change ................................. (1)% (5)% (16)%
% change in constant currency sales ............ (5)% (2)% (9)%
Division operating profit ..................... $ 92.9 $ 110.8 $ 119.6
% of sales ................................ 2.8% 3.3% 3.4%
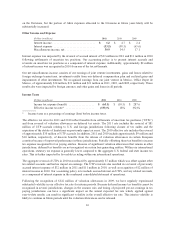
Sales in our International Division in U.S. dollars decreased 1% in 2011, 5% in 2010 and 16% in 2009. Constant
currency sales decreased 5% in 2011, 2% in 2010 and 9% in 2009. Excluding the revenue impact from the fourth
quarter 2010 dispositions of businesses in Israel and Japan and the deconsolidation of business in India, as well
as the first quarter 2011 acquisition of a business in Sweden (the “Portfolio Changes”), constant currency sales
were 1% lower in 2011 compared to 2010. The 53rd week added approximately $28 million to total Division
sales. Contract channel sales in constant currencies increased 3% in 2011 and 1% in 2010. The 2011 increase
reflects growth in field sales as a result of staff added in the last two years, as well as the 2011 acquisition.
Constant currency sales in the direct business declined 6% in 2011, after considering the Portfolio Changes, and
declined 5% in 2010.
Division operating profit totaled approximately $93 million in 2011, $111 million in 2010, and $120 million in
2009. Included in Division operating profit for 2011 and 2010 were charges of approximately $31 million and
$23 million, respectively. The 2011 charges primarily relate to severance and other costs associated with facility
closures and streamlining processes. The 2010 charges resulted from the sale of operating subsidiaries in Israel
and Japan, as well as facility closure and severance costs associated with consolidation arrangements in Europe.
23


