Office Depot 2011 Annual Report Download - page 139
Download and view the complete annual report
Please find page 139 of the 2011 Office Depot annual report below. You can navigate through the pages in the report by either clicking on the pages listed below, or by using the keyword search tool below to find specific information within the annual report.-
 1
1 -
2
-
3
-
4
-
5
-
6
-
7
-
8
-
9
-
10
-
11
-
12
-
13
-
14
-
15
-
16
-
17
-
18
-
19
-
20
-
21
-
22
-
23
-
24
-
25
-
26
-
27
-
28
-
29
-
30
-
31
-
32
-
33
-
34
-
35
-
36
-
37
-
38
-
39
-
40
-
41
-
42
-
43
-
44
-
45
-
46
-
47
-
48
-
49
-
50
-
51
-
52
-
53
-
54
-
55
-
56
-
57
-
58
-
59
-
60
-
61
-
62
-
63
-
64
-
65
-
66
-
67
-
68
-
69
-
70
-
71
-
72
-
73
-
74
-
75
-
76
-
77
-
78
-
79
-
80
-
81
-
82
-
83
-
84
-
85
-
86
-
87
-
88
-
89
-
90
-
91
-
92
-
93
-
94
-
95
-
96
-
97
-
98
-
99
-
100
-
101
-
102
-
103
-
104
-
105
-
106
-
107
-
108
-
109
-
110
-
111
-
112
-
113
-
114
-
115
-
116
-
117
-
118
-
119
-
120
-
121
-
122
-
123
-
124
-
125
-
126
-
127
-
128
-
 129
129 -
 130
130 -
 131
131 -
 132
132 -
 133
133 -
 134
134 -
 135
135 -
 136
136 -
 137
137 -
 138
138 -
 139
139 -
 140
140 -
 141
141 -
 142
142 -
 143
143 -
 144
144 -
 145
145 -
 146
146 -
 147
147 -
 148
148 -
 149
149 -
150
-
151
-
152
-
153
-
154
-
155
-
156
-
157
-
158
-
159
-
160
-
161
-
162
-
163
-
164
-
165
-
166
-
167
-
168
-
169
-
170
-
171
-
172
-
173
-
174
-
175
-
176
-
177
-
178
-
179
-
180
-
181
-
182
-
183
-
184
-
185
-
186
-
187
-
188
-
189
-
190
-
191
-
192
-
193
-
194
-
195
-
196
-
197
-
198
-
199
-
200
-
201
-
202
-
203
-
204
-
205
-
206
-
207
-
208
-
209
-
210
-
211
-
212
-
213
-
214
-
215
-
216
-
217
-
218
-
219
-
220
-
221
-
222
-
223
-
224
-
225
-
226
-
227
-
228
-
229
-
230
-
231
-
232
-
233
-
234
-
235
-
236
-
237
-
238
-
239
-
240
 |
 |

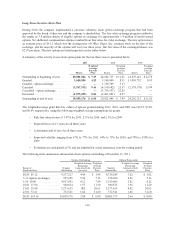
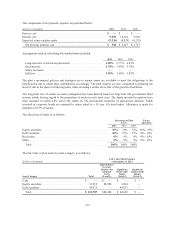
The intrinsic value of options exercised in 2011 and 2010, was $3.8 million, and $11.9 million, respectively.
There were no option exercises in 2009.
As of December 31, 2011, there was approximately $11.1 million of total stock-based compensation expense that
has not yet been recognized relating to non-vested awards granted under our option plans. This expense, net of
forfeitures, is expected to be recognized over a weighted-average period of approximately 1.9 years. Of the
8.3 million unvested shares, the company estimates that 7.9 million, or 95%, will vest. The number of exercisable
shares was 10.8 million shares of common stock at December 31, 2011 and 8.3 million shares of common stock
at December 25, 2010.
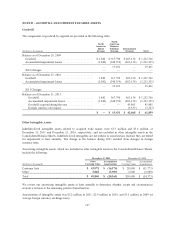
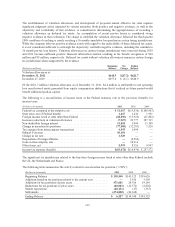
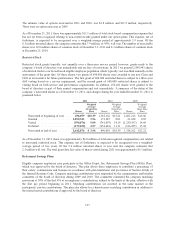
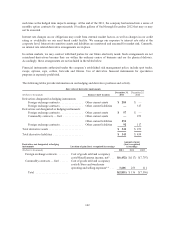
Restricted Stock
Restricted stock grants typically vest annually over a three-year service period; however, grants made to the
company’s board of directors vest immediately and are free of restrictions. In 2011 we granted 2,890,943 shares
of restricted stock to our broad-based eligible employee population which typically vest one-third annually on the
anniversary of the grant date. Of these shares, two grants of 600,000 shares were awarded to our new Chair and
CEO as an incentive for future performance. The first grant of 600,000 restricted shares is subject to a three-year
cliff vesting based on a service requirement, and the second grant of 600,000 restricted shares is subject to
vesting based on both service and performance requirements. In addition, 256,441 shares were granted to the
board of directors as part of their annual compensation and vest immediately. A summary of the status of the
company’s nonvested shares as of December 31, 2011, and changes during the year ended December 31, 2011 is
presented below.
2011 2010 2009
Shares
Weighted
Average
Grant-Date
Price Shares
Weighted
Average
Grant-Date
Price Shares
Weighted
Average
Grant-Date
Price
Nonvested at beginning of year .... 496,059 $10.39 1,318,162 $13.21 2,663,216 $14.06
Granted ...................... 2,890,943 3.96 173,387 8.01 21,628 0.85
Vested ....................... (594,876) 9.00 (741,007) 14.19 (1,230,397) 14.60
Forfeited ...................... (179,250) 4.97 (254,483) 11.31 (136,285) 15.24
Nonvested at end of year ......... 2,612,876 $ 3.96 496,059 $10.39 1,318,162 $13.21
As of December 31, 2011, there was approximately $6.8 million of total unrecognized compensation cost related
to nonvested restricted stock. This expense, net of forfeitures, is expected to be recognized over a weighted-
average period of two years. Of the 2.6 million unvested shares at year end, the company estimates that
2.3 million will vest. The total grant date fair value of shares vested during 2011 was approximately $5.3 million.
Retirement Savings Plans
Eligible company employees may participate in the Office Depot, Inc. Retirement Savings Plan (401(k) Plan),
which was approved by the board of directors. This plan allows those employees to contribute a percentage of
their salary, commissions and bonuses in accordance with plan limitations and provisions of Section 401(k) of
the Internal Revenue Code. Company matching contributions were suspended by the compensation and benefits
committee of the board of directors during 2009 and 2010. The committee reinstated the company matching
provisions at 50% of the first 4% of an employee’s contributions, subject to the limits of the plan, effective with
the first pay period beginning in 2011. Matching contributions are invested in the same manner as the
participants’ pre-tax contributions. The plan also allows for a discretionary matching contribution in addition to
the normal match contributions if approved by the board of directors.
137