Office Depot 2011 Annual Report Download - page 38
Download and view the complete annual report
Please find page 38 of the 2011 Office Depot annual report below. You can navigate through the pages in the report by either clicking on the pages listed below, or by using the keyword search tool below to find specific information within the annual report.-
 1
1 -
2
-
3
-
4
-
5
-
6
-
7
-
8
-
9
-
10
-
11
-
12
-
13
-
14
-
15
-
16
-
17
-
18
-
19
-
20
-
21
-
22
-
23
-
24
-
25
-
26
-
27
-
 28
28 -
 29
29 -
 30
30 -
 31
31 -
 32
32 -
 33
33 -
 34
34 -
 35
35 -
 36
36 -
 37
37 -
 38
38 -
 39
39 -
 40
40 -
 41
41 -
 42
42 -
 43
43 -
 44
44 -
 45
45 -
 46
46 -
 47
47 -
 48
48 -
49
-
50
-
51
-
52
-
53
-
54
-
55
-
56
-
57
-
58
-
59
-
60
-
61
-
62
-
63
-
64
-
65
-
66
-
67
-
68
-
69
-
70
-
71
-
72
-
73
-
74
-
75
-
76
-
77
-
78
-
79
-
80
-
81
-
82
-
83
-
84
-
85
-
86
-
87
-
88
-
89
-
90
-
91
-
92
-
93
-
94
-
95
-
96
-
97
-
98
-
99
-
100
-
101
-
102
-
103
-
104
-
105
-
106
-
107
-
108
-
109
-
110
-
111
-
112
-
113
-
114
-
115
-
116
-
117
-
118
-
119
-
120
-
121
-
122
-
123
-
124
-
125
-
126
-
127
-
128
-
129
-
130
-
131
-
132
-
133
-
134
-
135
-
136
-
137
-
138
-
139
-
140
-
141
-
142
-
143
-
144
-
145
-
146
-
147
-
148
-
149
-
150
-
151
-
152
-
153
-
154
-
155
-
156
-
157
-
158
-
159
-
160
-
161
-
162
-
163
-
164
-
165
-
166
-
167
-
168
-
169
-
170
-
171
-
172
-
173
-
174
-
175
-
176
-
177
-
178
-
179
-
180
-
181
-
182
-
183
-
184
-
185
-
186
-
187
-
188
-
189
-
190
-
191
-
192
-
193
-
194
-
195
-
196
-
197
-
198
-
199
-
200
-
201
-
202
-
203
-
204
-
205
-
206
-
207
-
208
-
209
-
210
-
211
-
212
-
213
-
214
-
215
-
216
-
217
-
218
-
219
-
220
-
221
-
222
-
223
-
224
-
225
-
226
-
227
-
228
-
229
-
230
-
231
-
232
-
233
-
234
-
235
-
236
-
237
-
238
-
239
-
240
 |
 |

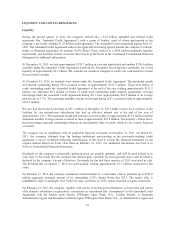
our credit ratings, our liquidity and our access to the capital markets. Certain of our existing indebtedness
matures in 2013 and there can be no assurance that we will be able to refinance all or a portion of that
indebtedness. If we are able to refinance all or a portion of that indebtedness, the terms of such refinancing will
likely be less favorable than the terms of our existing indebtedness.
MARKET SENSITIVE RISKS AND POSITIONS
The company has adopted an enterprise risk management process patterned after the principles set out by the
Committee of Sponsoring Organizations (COSO) in 2004. Management utilizes a common view of exposure
identification and risk management. A process is in place for periodic risk reviews and identification of
appropriate mitigation strategies.
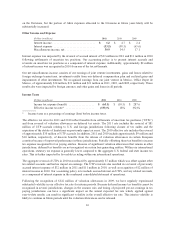
We have market risk exposure related to interest rates, foreign currency exchange rates, and commodities.
Market risk is measured as the potential negative impact on earnings, cash flows or fair values resulting from a
hypothetical change in interest rates or foreign currency exchange rates over the next year. Interest rate changes
on obligations may result from external market factors, as well as changes in our credit rating. We manage our
exposure to market risks at the corporate level. The portfolio of interest-sensitive assets and liabilities is
monitored to provide liquidity necessary to satisfy anticipated short-term needs. Our risk management policies
allow the use of specified financial instruments for hedging purposes only; speculation on interest rates, foreign
currency rates, or commodities is not permitted.
Interest Rate Risk
We are exposed to the impact of interest rate changes on cash, cash equivalents and debt obligations. The impact
on cash and short-term investments held at the end of 2011 from a hypothetical 10% decrease in interest rates
would be a decrease in interest income of less than $0.1 million.
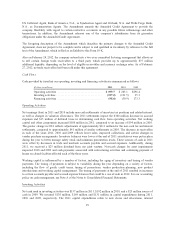
Market risk associated with our debt portfolio is summarized below:
2011 2010
(Dollars in thousands)
Carrying
Value
Fair
Value
Risk
Sensitivity
Carrying
Value
Fair
Value
Risk
Sensitivity
$400 million senior notes .......... $ 399,953 $ 381,067 $ 2,860 $ 400,067 $ 398,000 $ 4,800
Asset based credit facility ......... $—$—$—$ 52,488 $ 52,488 $ —
The risk sensitivity of fixed rate debt reflects the estimated increase in fair value from a 50 basis point decrease
in interest rates, calculated on a discounted cash flow basis. The sensitivity of variable rate debt reflects the
possible increase in interest expense during the next period from a 50 basis point change in interest rates
prevailing at year-end.
Foreign Exchange Rate Risk
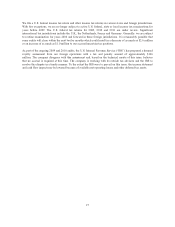
We conduct business through entities in various countries outside the United States where their functional
currency is not the U.S. dollar. While our company sells directly or indirectly to customers in 60 countries, the
principal operations of our International Division are in countries with Euro, British Pound and Mexican Peso
functional currencies. We continue to assess our exposure to foreign currency fluctuation against the U.S. dollar.
As of December 31, 2011, a 10% change in the applicable foreign exchange rates would result in an increase or
decrease in our pretax earnings of approximately $13 million.
Although operations generally are conducted in the relevant local currency, we also are subject to foreign
exchange transaction exposure when our subsidiaries transact business in a currency other than their own
functional currency. This exposure arises primarily from inventory purchases in a foreign currency. At
36