Office Depot 2011 Annual Report Download - page 121
Download and view the complete annual report
Please find page 121 of the 2011 Office Depot annual report below. You can navigate through the pages in the report by either clicking on the pages listed below, or by using the keyword search tool below to find specific information within the annual report.-
 1
1 -
2
-
3
-
4
-
5
-
6
-
7
-
8
-
9
-
10
-
11
-
12
-
13
-
14
-
15
-
16
-
17
-
18
-
19
-
20
-
21
-
22
-
23
-
24
-
25
-
26
-
27
-
28
-
29
-
30
-
31
-
32
-
33
-
34
-
35
-
36
-
37
-
38
-
39
-
40
-
41
-
42
-
43
-
44
-
45
-
46
-
47
-
48
-
49
-
50
-
51
-
52
-
53
-
54
-
55
-
56
-
57
-
58
-
59
-
60
-
61
-
62
-
63
-
64
-
65
-
66
-
67
-
68
-
69
-
70
-
71
-
72
-
73
-
74
-
75
-
76
-
77
-
78
-
79
-
80
-
81
-
82
-
83
-
84
-
85
-
86
-
87
-
88
-
89
-
90
-
91
-
92
-
93
-
94
-
95
-
96
-
97
-
98
-
99
-
100
-
101
-
102
-
103
-
104
-
105
-
106
-
107
-
108
-
109
-
110
-
 111
111 -
 112
112 -
 113
113 -
 114
114 -
 115
115 -
 116
116 -
 117
117 -
 118
118 -
 119
119 -
 120
120 -
 121
121 -
 122
122 -
 123
123 -
 124
124 -
 125
125 -
 126
126 -
 127
127 -
 128
128 -
 129
129 -
 130
130 -
 131
131 -
132
-
133
-
134
-
135
-
136
-
137
-
138
-
139
-
140
-
141
-
142
-
143
-
144
-
145
-
146
-
147
-
148
-
149
-
150
-
151
-
152
-
153
-
154
-
155
-
156
-
157
-
158
-
159
-
160
-
161
-
162
-
163
-
164
-
165
-
166
-
167
-
168
-
169
-
170
-
171
-
172
-
173
-
174
-
175
-
176
-
177
-
178
-
179
-
180
-
181
-
182
-
183
-
184
-
185
-
186
-
187
-
188
-
189
-
190
-
191
-
192
-
193
-
194
-
195
-
196
-
197
-
198
-
199
-
200
-
201
-
202
-
203
-
204
-
205
-
206
-
207
-
208
-
209
-
210
-
211
-
212
-
213
-
214
-
215
-
216
-
217
-
218
-
219
-
220
-
221
-
222
-
223
-
224
-
225
-
226
-
227
-
228
-
229
-
230
-
231
-
232
-
233
-
234
-
235
-
236
-
237
-
238
-
239
-
240
 |
 |

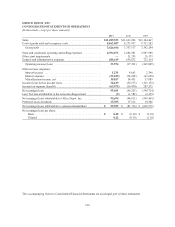
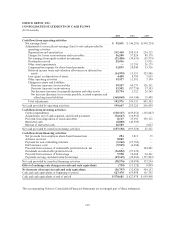
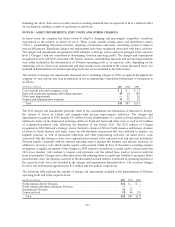
OFFICE DEPOT, INC.
CONSOLIDATED STATEMENTS OF CASH FLOWS
(In thousands)
2011 2010 2009
Cash flows from operating activities:
Net earnings (loss) ........................................... $ 95,691 $ (46,205) $(598,724)
Adjustments to reconcile net earnings (loss) to net cash provided by
operating activities: ........................................
Depreciation and amortization ................................ 211,410 208,319 224,115
Charges for losses on inventories and receivables ................. 56,200 57,824 80,178
Net earnings from equity method investments .................... (31,426) (30,635) (30,579)
Dividends received ......................................... 25,016 — 13,931
Other asset impairments ..................................... —51,295 26,175
Compensation expense for share-based payments ................. 13,895 20,840 33,316
Deferred income taxes and valuation allowances on deferred tax
assets .................................................. (14,999) 15,551 325,886
Loss (gain) on disposition of assets ............................ 4,420 8,709 7,655
Other operating activities .................................... 19,937 11,501 7,199
Changes in assets and liabilities: ..............................
Decrease (increase) in receivables ........................... 99,927 60,273 126,131
Decrease (increase) in inventories ........................... 53,902 (87,724) 37,583
Net decrease (increase) in prepaid expenses and other assets ...... 25,754 2,522 28,165
Net increase (decrease) in accounts payable, accrued expenses and
other long-term liabilities ................................ (360,060) (69,144) 15,408
Total adjustments .......................................... 103,976 249,331 895,163
Net cash provided by operating activities ........................... 199,667 203,126 296,439
Cash flows from investing activities:
Capital expenditures .......................................... (130,317) (169,452) (130,847)
Acquisitions, net of cash acquired, and related payments ............. (72,667) (10,952) —
Proceeds from disposition of assets and other ...................... 8,117 35,393 150,131
Restricted cash .............................................. (8,800) (46,509) —
Release of restricted cash ...................................... 46,509 — 6,037
Net cash provided by (used in) investing activities .................... (157,158) (191,520) 25,321
Cash flows from financing activities:
Net proceeds from employee share-based transactions ............... 254 1,011 35
Advance received ............................................ 8,800 ——
Payment for non-controlling interests ............................ (1,262) (21,786) —
Debt issuance costs ........................................... (9,945) (4,688) —
Proceeds from issuance of redeemable preferred stock, net ........... —— 324,801
Dividends on redeemable preferred stock ......................... (36,852) (27,639) —
Proceeds from issuance of borrowings ........................... 9,598 52,488 24,321
Payments on long- and short-term borrowings ..................... (69,169) (30,284) (175,863)
Net cash provided by (used in) financing activities .................... (98,576) (30,898) 173,294
Effect of exchange rate changes on cash and cash equivalents ........ (730) (13,128) 9,099
Net increase (decrease) in cash and cash equivalents ................ (56,797) (32,420) 504,153
Cash and cash equivalents at beginning of period ..................... 627,478 659,898 155,745
Cash and cash equivalents at end of period .......................... $ 570,681 $ 627,478 $ 659,898
The accompanying Notes to Consolidated Financial Statements are an integral part of these statements.
119