Office Depot 2011 Annual Report Download - page 72
Download and view the complete annual report
Please find page 72 of the 2011 Office Depot annual report below. You can navigate through the pages in the report by either clicking on the pages listed below, or by using the keyword search tool below to find specific information within the annual report.-
 1
1 -
2
-
3
-
4
-
5
-
6
-
7
-
8
-
9
-
10
-
11
-
12
-
13
-
14
-
15
-
16
-
17
-
18
-
19
-
20
-
21
-
22
-
23
-
24
-
25
-
26
-
27
-
28
-
29
-
30
-
31
-
32
-
33
-
34
-
35
-
36
-
37
-
38
-
39
-
40
-
41
-
42
-
43
-
44
-
45
-
46
-
47
-
48
-
49
-
50
-
51
-
52
-
53
-
54
-
55
-
56
-
57
-
58
-
59
-
60
-
61
-
 62
62 -
 63
63 -
 64
64 -
 65
65 -
 66
66 -
 67
67 -
 68
68 -
 69
69 -
 70
70 -
 71
71 -
 72
72 -
 73
73 -
 74
74 -
 75
75 -
 76
76 -
 77
77 -
 78
78 -
 79
79 -
 80
80 -
 81
81 -
 82
82 -
83
-
84
-
85
-
86
-
87
-
88
-
89
-
90
-
91
-
92
-
93
-
94
-
95
-
96
-
97
-
98
-
99
-
100
-
101
-
102
-
103
-
104
-
105
-
106
-
107
-
108
-
109
-
110
-
111
-
112
-
113
-
114
-
115
-
116
-
117
-
118
-
119
-
120
-
121
-
122
-
123
-
124
-
125
-
126
-
127
-
128
-
129
-
130
-
131
-
132
-
133
-
134
-
135
-
136
-
137
-
138
-
139
-
140
-
141
-
142
-
143
-
144
-
145
-
146
-
147
-
148
-
149
-
150
-
151
-
152
-
153
-
154
-
155
-
156
-
157
-
158
-
159
-
160
-
161
-
162
-
163
-
164
-
165
-
166
-
167
-
168
-
169
-
170
-
171
-
172
-
173
-
174
-
175
-
176
-
177
-
178
-
179
-
180
-
181
-
182
-
183
-
184
-
185
-
186
-
187
-
188
-
189
-
190
-
191
-
192
-
193
-
194
-
195
-
196
-
197
-
198
-
199
-
200
-
201
-
202
-
203
-
204
-
205
-
206
-
207
-
208
-
209
-
210
-
211
-
212
-
213
-
214
-
215
-
216
-
217
-
218
-
219
-
220
-
221
-
222
-
223
-
224
-
225
-
226
-
227
-
228
-
229
-
230
-
231
-
232
-
233
-
234
-
235
-
236
-
237
-
238
-
239
-
240
 |
 |

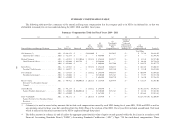
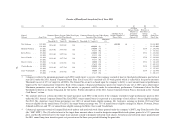
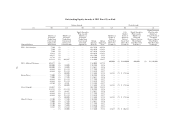
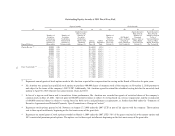
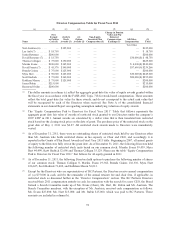
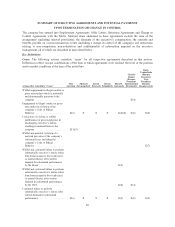
Grants of Plan-Based Awards in Fiscal Year 2011
(a) (b) (c-e) (f-h) (i) (j) (k) (l)
Named
Officers Grant Date
Estimated Future Payouts Under Non-Equity
Incentive Plan Awards
Estimated Future Payouts Under Equity
Incentive Plan Awards
All Other Stock
Awards: Number of
Shares/Units
All Other
Option Awards:
Number of
Securities
Underlying
Options (#)
(4)
Exercise or
Base Price of
Option
Awards
($/Sh)
(5)
Grant Date
Fair Value
(1)
Threshold ($)
(1)(2)
Target ($)
(1)
Maximum ($) Threshold (#)
(3)
Target (#)
Maximum
(#)
Neil Austrian ....... 5/23/2011 $236,923 $947,692 NA — — — 600,000 (6) — — $2,412,000
5/23/2011 600,000 (6) — — — $1,872,000
Michael Newman .... 5/3/2011 $119,441 $477,764 NA — 140,000 (O) — — — $5.34 $ 294,840
5/3/2011 83,333 (R) — — — — $ 355,832
Kevin Peters ........ 5/3/2011 $119,441 $477,764 NA — 140,000 (O) — — — $5.34 $ 294,840
5/3/2011 83,333 (R) — — — — $ 355,832
Steve Schmidt ....... 5/3/2011 $119,441 $477,764 NA — 140,000 (O) — — — $5.34 $ 294,840
5/3/2011 83,333 (R) — — — — $ 355,832
Elisa D. Garcia ...... 5/3/2011 $ 78,481 $313,923 NA — 80,000 (O) — — — $5.34 $ 168,480
5/3/2011 47,619 (R) — — — — $ 203,333
Charles Brown ...... 5/3/2011 $119,441 $477,764 NA — 140,000 (O) — — — $5.34 $ 294,840
5/3/2011 83,333 (R) — — — — $ 355,832
Daisy Vanderlinde . . . 5/3/2011 $ 78,481 $313,923 NA — 80,000 (O) — — — $5.34 $ 168,480
5/3/2011 47,619 (R) — — — — $ 203,333
(1) Column (c) reflects the minimum payments each NEO could expect to receive if the company reached at least its threshold performance goal in fiscal
year 2011 under the 2011 Annual Corporate Bonus Plan. Fiscal year 2011 consisted of a 53-week period which is reflected in the payout amounts.
Threshold was set at 25% of target for all NEOs. The Bonus Plan award was based upon the company’s ability to meet annual financial performance
targets set by the Compensation Committee. Each of the company’s financial performance goals were targeted to pay out at 100% upon achievement.
Maximum parameters were not set for any of the metrics, so payment could be made for extraordinary performance. Performance below the Plan
threshold resulted in no bonus being paid for that metric. Further description of the 2011 Annual Corporate Bonus Plan is discussed in the “Annual
Cash Bonus” section.
(2) The amounts shown in column (d) reflect the target payments each NEO could receive if the company reached its target performance goals in 2011
under the 2011 Annual Corporate Bonus Plan. Each NEO’s target annual bonus is expressed as a percentage of such officer’s bonus eligible earnings.
For 2011, Mr. Austrian’s target bonus percentage was 140% of annual bonus eligible earnings. Mr. Austrian’s earnings as Interim CEO and Chair
were not eligible for the annual bonus. For 2011, the target bonus percentage was 75% of annual bonus eligible earnings for Messrs. Newman, Peters,
Schmidt and Brown and 70% of annual bonus eligible earnings for Mlles. Garcia and Vanderlinde.
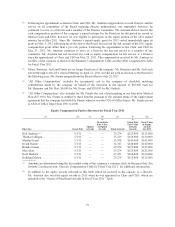
(3) Column (g) represents awards of nonqualified stock options and restricted stock shares granted under the company’s 2007 Long-Term Incentive Plan
(the “2007 LTIP”). The (O) reflected next to the target share amounts above is used to designate nonqualified stock options granted at a 25% premium
price, and the (R) reflected next to the target share amounts is used to designate restricted stock shares. All options and restricted shares granted under
the 2011 annual long-term incentive grant vest pro-rata over the three-year period following the grant date.
70