Office Depot 2011 Annual Report Download - page 123
Download and view the complete annual report
Please find page 123 of the 2011 Office Depot annual report below. You can navigate through the pages in the report by either clicking on the pages listed below, or by using the keyword search tool below to find specific information within the annual report.-
 1
1 -
2
-
3
-
4
-
5
-
6
-
7
-
8
-
9
-
10
-
11
-
12
-
13
-
14
-
15
-
16
-
17
-
18
-
19
-
20
-
21
-
22
-
23
-
24
-
25
-
26
-
27
-
28
-
29
-
30
-
31
-
32
-
33
-
34
-
35
-
36
-
37
-
38
-
39
-
40
-
41
-
42
-
43
-
44
-
45
-
46
-
47
-
48
-
49
-
50
-
51
-
52
-
53
-
54
-
55
-
56
-
57
-
58
-
59
-
60
-
61
-
62
-
63
-
64
-
65
-
66
-
67
-
68
-
69
-
70
-
71
-
72
-
73
-
74
-
75
-
76
-
77
-
78
-
79
-
80
-
81
-
82
-
83
-
84
-
85
-
86
-
87
-
88
-
89
-
90
-
91
-
92
-
93
-
94
-
95
-
96
-
97
-
98
-
99
-
100
-
101
-
102
-
103
-
104
-
105
-
106
-
107
-
108
-
109
-
110
-
111
-
112
-
 113
113 -
 114
114 -
 115
115 -
 116
116 -
 117
117 -
 118
118 -
 119
119 -
 120
120 -
 121
121 -
 122
122 -
 123
123 -
 124
124 -
 125
125 -
 126
126 -
 127
127 -
 128
128 -
 129
129 -
 130
130 -
 131
131 -
 132
132 -
 133
133 -
134
-
135
-
136
-
137
-
138
-
139
-
140
-
141
-
142
-
143
-
144
-
145
-
146
-
147
-
148
-
149
-
150
-
151
-
152
-
153
-
154
-
155
-
156
-
157
-
158
-
159
-
160
-
161
-
162
-
163
-
164
-
165
-
166
-
167
-
168
-
169
-
170
-
171
-
172
-
173
-
174
-
175
-
176
-
177
-
178
-
179
-
180
-
181
-
182
-
183
-
184
-
185
-
186
-
187
-
188
-
189
-
190
-
191
-
192
-
193
-
194
-
195
-
196
-
197
-
198
-
199
-
200
-
201
-
202
-
203
-
204
-
205
-
206
-
207
-
208
-
209
-
210
-
211
-
212
-
213
-
214
-
215
-
216
-
217
-
218
-
219
-
220
-
221
-
222
-
223
-
224
-
225
-
226
-
227
-
228
-
229
-
230
-
231
-
232
-
233
-
234
-
235
-
236
-
237
-
238
-
239
-
240
 |
 |
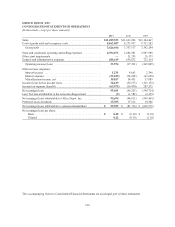
date of acquisition are classified as cash equivalents. Amounts in transit from banks for customer credit card and
debit card transactions that process in less than seven days are classified as cash. The banks process the majority
of these amounts within one to two business days. Approximately $9 million and $53 million of restricted cash
held on deposit was included in other current assets at December 31, 2011 and December 25, 2010, respectively.
The 2011 amount relates to an advance received that was placed in escrow and ultimately settled in January
2012. Approximately $47 million of restricted cash at the end of the year 2010 relates to the acquisition of
Svanströms Gruppen (Frans Svanströms & Co AB) which was initiated in 2010 and completed in the first quarter
of 2011.
Cash Management: Our cash management process generally utilizes zero balance accounts which provide for
the settlement of the related disbursement accounts and cash concentration on a daily basis. Accounts payable
and accrued expenses as of December 31, 2011 and December 25, 2010 included $50 million and $64 million,
respectively, of amounts not yet presented for payment drawn in excess of disbursement account book balances,
after considering existing offset provisions. We may borrow during the period, which may result in higher levels
of borrowings and invested cash within the period. At the end of the period, cash may be used to minimize
borrowings outstanding at the balance sheet date. Approximately $174 million of our cash and cash equivalents
was held outside the U.S. at December 31, 2011.
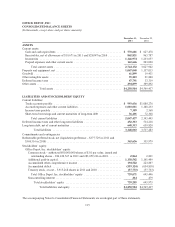
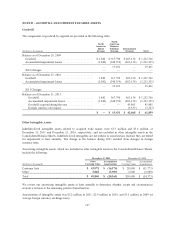
Receivables: Trade receivables, net, totaled $631.7 million and $687.4 million at December 31, 2011 and
December 25, 2010, respectively. An allowance for doubtful accounts has been recorded to reduce receivables to
an amount expected to be collectible from customers. The allowance recorded at December 31, 2011 and
December 25, 2010 was $19.7 million and $28.0 million, respectively.
Our exposure to credit risk associated with trade receivables is limited by having a large customer base that
extends across many different industries and geographic regions. However, receivables may be adversely
affected by an economic slowdown in the U.S. or internationally. No single customer accounted for more than
10% of our total sales in 2011, 2010 or 2009.
Other receivables are $231.1 million and $276.4 million as of December 31, 2011 and December 25, 2010,
respectively, of which $181.6 million and $198.3 million are amounts due from vendors under purchase rebate,
cooperative advertising and various other marketing programs.
Inventories: Inventories are stated at the lower of cost or market value and are reduced for inventory losses
based on physical counts. In-bound freight is included as a cost of inventories. Also, certain vendor allowances
that are related to inventory purchases are considered to reduce the product cost. The weighted average method is
used to determine the cost of our inventory in North America and the first-in-first-out method is used for
inventory held within our international operations.
Income Taxes: Income tax expense is recognized at applicable U.S. or international tax rates. Certain revenue
and expense items may be recognized in one period for financial statement purposes and in a different period’s
income tax return. The tax effects of such differences are reported as deferred income taxes. Valuation
allowances are recorded for periods in which realization of deferred tax assets does not meet a more likely than
not standard. See Note F for additional information on deferred income taxes.
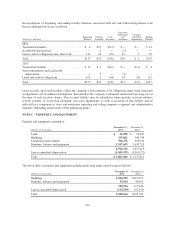
Property and Equipment: Property and equipment additions are recorded at cost. Depreciation and amortization
is recognized over their estimated useful lives using the straight-line method. The useful lives of depreciable
assets are estimated to be 15-30 years for buildings and 3-10 years for furniture, fixtures and equipment.
Computer software is amortized over three years for common office applications, five years for larger business
applications and seven years for certain enterprise-wide systems. Leasehold improvements are amortized over the
shorter of the estimated economic lives of the improvements or the terms of the underlying leases, including
renewal options considered reasonably assured at inception of the leases.
121