Office Depot 2011 Annual Report Download - page 144
Download and view the complete annual report
Please find page 144 of the 2011 Office Depot annual report below. You can navigate through the pages in the report by either clicking on the pages listed below, or by using the keyword search tool below to find specific information within the annual report.-
 1
1 -
2
-
3
-
4
-
5
-
6
-
7
-
8
-
9
-
10
-
11
-
12
-
13
-
14
-
15
-
16
-
17
-
18
-
19
-
20
-
21
-
22
-
23
-
24
-
25
-
26
-
27
-
28
-
29
-
30
-
31
-
32
-
33
-
34
-
35
-
36
-
37
-
38
-
39
-
40
-
41
-
42
-
43
-
44
-
45
-
46
-
47
-
48
-
49
-
50
-
51
-
52
-
53
-
54
-
55
-
56
-
57
-
58
-
59
-
60
-
61
-
62
-
63
-
64
-
65
-
66
-
67
-
68
-
69
-
70
-
71
-
72
-
73
-
74
-
75
-
76
-
77
-
78
-
79
-
80
-
81
-
82
-
83
-
84
-
85
-
86
-
87
-
88
-
89
-
90
-
91
-
92
-
93
-
94
-
95
-
96
-
97
-
98
-
99
-
100
-
101
-
102
-
103
-
104
-
105
-
106
-
107
-
108
-
109
-
110
-
111
-
112
-
113
-
114
-
115
-
116
-
117
-
118
-
119
-
120
-
121
-
122
-
123
-
124
-
125
-
126
-
127
-
128
-
129
-
130
-
131
-
132
-
133
-
 134
134 -
 135
135 -
 136
136 -
 137
137 -
 138
138 -
 139
139 -
 140
140 -
 141
141 -
 142
142 -
 143
143 -
 144
144 -
 145
145 -
 146
146 -
 147
147 -
 148
148 -
 149
149 -
 150
150 -
 151
151 -
 152
152 -
 153
153 -
 154
154 -
155
-
156
-
157
-
158
-
159
-
160
-
161
-
162
-
163
-
164
-
165
-
166
-
167
-
168
-
169
-
170
-
171
-
172
-
173
-
174
-
175
-
176
-
177
-
178
-
179
-
180
-
181
-
182
-
183
-
184
-
185
-
186
-
187
-
188
-
189
-
190
-
191
-
192
-
193
-
194
-
195
-
196
-
197
-
198
-
199
-
200
-
201
-
202
-
203
-
204
-
205
-
206
-
207
-
208
-
209
-
210
-
211
-
212
-
213
-
214
-
215
-
216
-
217
-
218
-
219
-
220
-
221
-
222
-
223
-
224
-
225
-
226
-
227
-
228
-
229
-
230
-
231
-
232
-
233
-
234
-
235
-
236
-
237
-
238
-
239
-
240
 |
 |

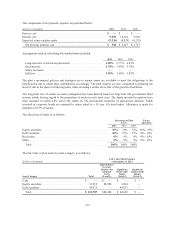
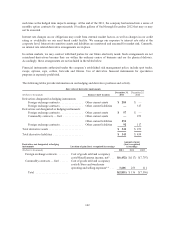
such time as the hedged item impacts earnings. At the end of the 2011, the company had entered into a series of
monthly option contracts for approximately 10 million gallons of fuel through December 2012 that may or may
not be executed.
Interest rate changes on our obligations may result from external market factors, as well as changes in our credit
rating or availability on our asset based credit facility. We manage our exposure to interest rate risks at the
corporate level. Interest rate sensitive assets and liabilities are monitored and assessed for market risk. Currently,
no interest rate related derivative arrangements are in place.
In certain markets, we may contract with third parties for our future electricity needs. Such arrangements are not
considered derivatives because they are within the ordinary course of business and are for physical delivery.
Accordingly, these arrangements are not included in the tables below.
Financial instruments authorized under the company’s established risk management policy include spot trades,
swaps, options, caps, collars, forwards and futures. Use of derivative financial instruments for speculative
purposes is expressly prohibited.
The following tables provide information on our hedging and derivative positions and activity.
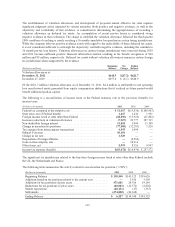
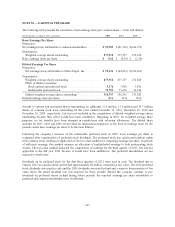
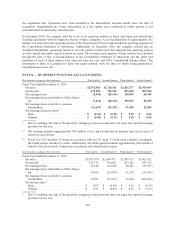
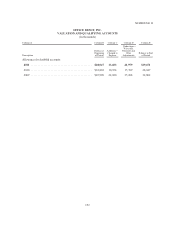
Fair value of derivative instruments
(Dollars in thousands) Balance sheet location
December 31,
2011
December 25,
2010
Derivatives designated as hedging instruments:
Foreign exchange contracts ................ Other current assets $ 284 $—
Foreign exchange contracts ................ Other current liabilities —317
Derivatives not designated as hedging instruments:
Foreign exchange contracts ................ Other current assets $57 $—
Commodity contracts — fuel .............. Other current assets —253
Other current liabilities 251
Foreign exchange contracts ................ Other current liabilities 92 117
Total derivative assets ........................ $ 341 $ 253
Total derivative liabilities ..................... $ 343 $ 434
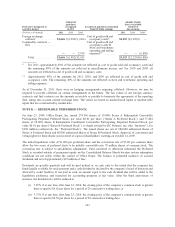
Derivatives not designated as hedging
instruments Location of gain/(loss) recognized in earnings
Amount of gain/
(loss) recognized
in earnings
(Dollars in thousands) 2011 2010 2009
Foreign exchange contracts ........ Cost of goods sold and occupancy
costs/Miscellaneous income, net* . . . $(6,452) $(117) $(7,707)
Commodity contracts — fuel ...... Cost of goods sold and occupancy
costs & Store and warehouse
operating and selling expenses** . . . 3,601 253 111
Total ....................... $(2,851) $ 136 $(7,596)
142