Office Depot 2011 Annual Report Download - page 147
Download and view the complete annual report
Please find page 147 of the 2011 Office Depot annual report below. You can navigate through the pages in the report by either clicking on the pages listed below, or by using the keyword search tool below to find specific information within the annual report.-
 1
1 -
2
-
3
-
4
-
5
-
6
-
7
-
8
-
9
-
10
-
11
-
12
-
13
-
14
-
15
-
16
-
17
-
18
-
19
-
20
-
21
-
22
-
23
-
24
-
25
-
26
-
27
-
28
-
29
-
30
-
31
-
32
-
33
-
34
-
35
-
36
-
37
-
38
-
39
-
40
-
41
-
42
-
43
-
44
-
45
-
46
-
47
-
48
-
49
-
50
-
51
-
52
-
53
-
54
-
55
-
56
-
57
-
58
-
59
-
60
-
61
-
62
-
63
-
64
-
65
-
66
-
67
-
68
-
69
-
70
-
71
-
72
-
73
-
74
-
75
-
76
-
77
-
78
-
79
-
80
-
81
-
82
-
83
-
84
-
85
-
86
-
87
-
88
-
89
-
90
-
91
-
92
-
93
-
94
-
95
-
96
-
97
-
98
-
99
-
100
-
101
-
102
-
103
-
104
-
105
-
106
-
107
-
108
-
109
-
110
-
111
-
112
-
113
-
114
-
115
-
116
-
117
-
118
-
119
-
120
-
121
-
122
-
123
-
124
-
125
-
126
-
127
-
128
-
129
-
130
-
131
-
132
-
133
-
134
-
135
-
136
-
 137
137 -
 138
138 -
 139
139 -
 140
140 -
 141
141 -
 142
142 -
 143
143 -
 144
144 -
 145
145 -
 146
146 -
 147
147 -
 148
148 -
 149
149 -
 150
150 -
 151
151 -
 152
152 -
 153
153 -
 154
154 -
 155
155 -
 156
156 -
 157
157 -
158
-
159
-
160
-
161
-
162
-
163
-
164
-
165
-
166
-
167
-
168
-
169
-
170
-
171
-
172
-
173
-
174
-
175
-
176
-
177
-
178
-
179
-
180
-
181
-
182
-
183
-
184
-
185
-
186
-
187
-
188
-
189
-
190
-
191
-
192
-
193
-
194
-
195
-
196
-
197
-
198
-
199
-
200
-
201
-
202
-
203
-
204
-
205
-
206
-
207
-
208
-
209
-
210
-
211
-
212
-
213
-
214
-
215
-
216
-
217
-
218
-
219
-
220
-
221
-
222
-
223
-
224
-
225
-
226
-
227
-
228
-
229
-
230
-
231
-
232
-
233
-
234
-
235
-
236
-
237
-
238
-
239
-
240
 |
 |

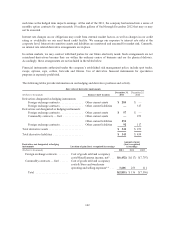
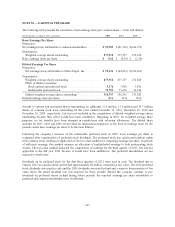
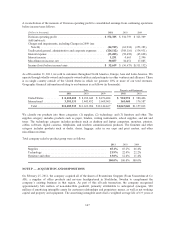
NOTE M — EARNINGS PER SHARE
The following table presents the calculation of net earnings (loss) per common share — basic and diluted:
(In thousands, except per share amounts) 2011 2010 2009
Basic Earnings Per Share
Numerator:
Net earnings (loss) attributable to common shareholders ......... $ 59,989 $ (81,736) $(626,971)
Denominator:
Weighted-average shares outstanding ..................... 277,918 275,557 272,828
Basic earnings (loss) per share ............................. $ 0.22 $ (0.30) $ (2.30)
Diluted Earnings Per Share
Numerator:
Net earnings (loss) attributable to Office Depot, Inc. .......... $ 95,694 $ (44,623) $(596,465)
Denominator:
Weighted-average shares outstanding ..................... 277,918 275,557 272,828
Effect of dilutive securities:
Stock options and restricted stock ...................... 5,176 7,060 3,836
Redeemable preferred stock ........................... 73,703 73,676 36,418
Diluted weighted-average shares outstanding ............... 356,797 356,293 313,082
Diluted earnings (loss) per share ........................... N/A N/A N/A
Awards of options and nonvested shares representing an additional 13.6 million, 13.0 million and 14.7 million
shares of common stock were outstanding for the years ended December 31, 2011, December 25, 2010 and
December 26, 2009, respectively, but were not included in the computation of diluted weighted-average shares
outstanding because their effect would have been antidilutive. Beginning in 2010, for weighted average share
purposes, no tax benefits have been assumed in jurisdictions with valuation allowances. The diluted share
amounts for 2011, 2010 and 2009 are provided for informational purposes, as the level of earnings (loss) for the
periods causes basic earnings per share to be the most dilutive.
Following the company’s issuance of the redeemable preferred stock in 2009, basic earnings per share is
computed after consideration of preferred stock dividends. The preferred stock has certain participation rights
with common stock resulting in application of the two-class method for computing earnings per share. In periods
of sufficient earnings, this method assumes an allocation of undistributed earnings to both participating stock
classes. The two-class method impacted the computation of earnings for the third quarter of 2011, but was not
applicable to the full year 2011 because if would have been antidulitive. The preferred shareholders are not
required to fund losses.
Dividends on its preferred stock for the first three quarters of 2011 were paid in cash. The dividend due in
January 2012 was paid-in-kind, and totaled approximately $8 million, measured at fair value. The 2010 preferred
stock dividends were paid in cash and the 2009 dividends were paid in-kind and a separate determination of fair
value above the stated dividend rate was required for those periods. Should the company continue to pay
dividends on preferred shares in-kind during future periods, the reported earnings per share attributable to
preferred and common shareholders may be different.
145