Office Depot 2011 Annual Report Download - page 26
Download and view the complete annual report
Please find page 26 of the 2011 Office Depot annual report below. You can navigate through the pages in the report by either clicking on the pages listed below, or by using the keyword search tool below to find specific information within the annual report.-
 1
1 -
2
-
3
-
4
-
5
-
6
-
7
-
8
-
9
-
10
-
11
-
12
-
13
-
14
-
15
-
 16
16 -
 17
17 -
 18
18 -
 19
19 -
 20
20 -
 21
21 -
 22
22 -
 23
23 -
 24
24 -
 25
25 -
 26
26 -
 27
27 -
 28
28 -
 29
29 -
 30
30 -
 31
31 -
 32
32 -
 33
33 -
 34
34 -
 35
35 -
 36
36 -
37
-
38
-
39
-
40
-
41
-
42
-
43
-
44
-
45
-
46
-
47
-
48
-
49
-
50
-
51
-
52
-
53
-
54
-
55
-
56
-
57
-
58
-
59
-
60
-
61
-
62
-
63
-
64
-
65
-
66
-
67
-
68
-
69
-
70
-
71
-
72
-
73
-
74
-
75
-
76
-
77
-
78
-
79
-
80
-
81
-
82
-
83
-
84
-
85
-
86
-
87
-
88
-
89
-
90
-
91
-
92
-
93
-
94
-
95
-
96
-
97
-
98
-
99
-
100
-
101
-
102
-
103
-
104
-
105
-
106
-
107
-
108
-
109
-
110
-
111
-
112
-
113
-
114
-
115
-
116
-
117
-
118
-
119
-
120
-
121
-
122
-
123
-
124
-
125
-
126
-
127
-
128
-
129
-
130
-
131
-
132
-
133
-
134
-
135
-
136
-
137
-
138
-
139
-
140
-
141
-
142
-
143
-
144
-
145
-
146
-
147
-
148
-
149
-
150
-
151
-
152
-
153
-
154
-
155
-
156
-
157
-
158
-
159
-
160
-
161
-
162
-
163
-
164
-
165
-
166
-
167
-
168
-
169
-
170
-
171
-
172
-
173
-
174
-
175
-
176
-
177
-
178
-
179
-
180
-
181
-
182
-
183
-
184
-
185
-
186
-
187
-
188
-
189
-
190
-
191
-
192
-
193
-
194
-
195
-
196
-
197
-
198
-
199
-
200
-
201
-
202
-
203
-
204
-
205
-
206
-
207
-
208
-
209
-
210
-
211
-
212
-
213
-
214
-
215
-
216
-
217
-
218
-
219
-
220
-
221
-
222
-
223
-
224
-
225
-
226
-
227
-
228
-
229
-
230
-
231
-
232
-
233
-
234
-
235
-
236
-
237
-
238
-
239
-
240
 |
 |

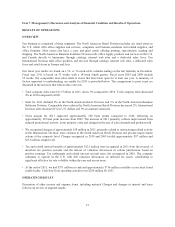
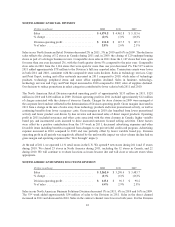
The 2010 subsidiary sales reflect the company’s decision to change its investment model in those countries from
direct operations to continued cash flow from product sales and other arrangements. The company anticipates
recognizing additional charges in 2012 as operational consolidation continues and the related accounting
recognition criteria are met.
The decreases in Division operating profit in 2011, 2010 and 2009 were impacted by the flow through impact
of lower sales levels. Gross profit as a percent of sales increased in 2011, but decreased after considering the
Portfolio Changes. This decrease reflects a change in the mix of direct and contract sales, product costs not
passed along to customers, and a negative impact of the 53rd week, partially offset by lower occupancy costs.
Operating expenses decreased across the Division, reflecting benefits from restructuring activities initiated in
prior periods. The operating profit comparison of 2010 to 2009 also reflects higher vendor rebates in 2009 and
higher product costs in 2010 that were not passed on to customers, partially offset by lower variable based pay.
For 2009, the negative flow through impact was partially offset by lower operating expenses, including a
decrease in distribution costs as well as lower payroll and advertising expenses.
For U.S. reporting, the International Division’s sales are translated into U.S. dollars at average exchange rates
experienced during the year. The Division’s reported sales were positively impacted by approximately $147
million in 2011, negatively impacted by $80 million in 2010 and positively impacted by $305 million in 2009
from changes in foreign currency exchange rates. Division operating profit was positively impacted by $4 million
in 2011, negatively impacted by $3 million in 2010 and negatively impacted by $6 million in 2009 from changes
in foreign exchange rates. Internally, we analyze our international operations in terms of local currency
performance to allow focus on operating trends and results.
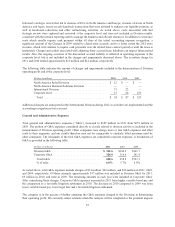
CORPORATE AND OTHER
Asset Impairments, Exit Costs and Other Charges
In recent years, the company has taken actions to adapt to changing and increasingly competitive conditions
experienced in the markets in which we serve. These actions include closing stores and distribution centers
(“DCs”), consolidating functional activities, disposing of businesses and assets, and taking actions to improve
process efficiencies. Significant charges and impairments have been recognized associated with these activities.
The charges and impairments recognized in 2009 related to a strategic review and were managed at the corporate
level (“Charges”) and not considered in determining Division operating profit. The charges and impairments
recognized in 2011 and 2010 associated with facility closures, consolidating functions and process improvements
were either included in the determination of Division operating profit or as corporate costs, depending on the
underlying activity. Store-level impairments and store closure costs, unrelated to the actions discussed above, are
included in determination of Division operating profit and are not included in the tables below.
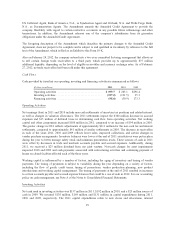
The amount of charges and impairments discussed above recognized throughout the company by year and the
line item presentation in our accompanying Consolidated Statements of Operations is as follows.
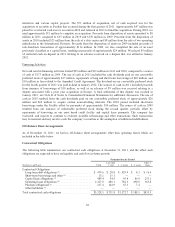
(Dollars in millions) 2011 2010 2009
Cost of goods sold and occupancy costs ..................$2$—$13
Store and warehouse operating and selling expenses ........ 25 14 188
Other asset impairments .............................. — 51 26
General and administrative expenses .................... 31 22 26
Total ........................................... $ 58 $ 87 $ 253
The 2011 charges and impairments relate to the consolidation and elimination of functions in Europe, the closure
of stores in Canada and company-wide process improvement initiatives. The charges and impairments
recognized in 2010 include $51 million for the abandonment of a software application, $23 million for losses on
the disposal of operating entities in Israel and Japan and other costs, as well as $13 million of compensation-
related costs following the departure of our former CEO. The $253 million of Charges recognized in 2009
24