Entergy 2009 Annual Report Download - page 97
Download and view the complete annual report
Please find page 97 of the 2009 Entergy annual report below. You can navigate through the pages in the report by either clicking on the pages listed below, or by using the keyword search tool below to find specific information within the annual report.-
 1
1 -
2
-
3
-
4
-
5
-
6
-
7
-
8
-
9
-
10
-
11
-
12
-
13
-
14
-
15
-
16
-
17
-
18
-
19
-
20
-
21
-
22
-
23
-
24
-
25
-
26
-
27
-
28
-
29
-
30
-
31
-
32
-
33
-
34
-
35
-
36
-
37
-
38
-
39
-
40
-
41
-
42
-
43
-
44
-
45
-
46
-
47
-
48
-
49
-
50
-
51
-
52
-
53
-
54
-
55
-
56
-
57
-
58
-
59
-
60
-
61
-
62
-
63
-
64
-
65
-
66
-
67
-
68
-
69
-
70
-
71
-
72
-
73
-
74
-
75
-
76
-
77
-
78
-
79
-
80
-
81
-
82
-
83
-
84
-
85
-
86
-
 87
87 -
 88
88 -
 89
89 -
 90
90 -
 91
91 -
 92
92 -
 93
93 -
 94
94 -
 95
95 -
 96
96 -
 97
97 -
 98
98 -
 99
99 -
 100
100 -
 101
101 -
 102
102 -
 103
103 -
 104
104 -
 105
105 -
 106
106 -
 107
107 -
108
-
109
-
110
-
111
-
112
-
113
-
114
-
115
-
116
-
117
-
118
-
119
-
120
-
121
-
122
-
123
-
124
-
125
-
126
-
127
-
128
-
129
-
130
-
131
-
132
-
133
-
134
-
135
-
136
-
137
-
138
-
139
-
140
-
141
-
142
-
143
-
144
-
145
-
146
-
147
-
148
-
149
-
150
-
151
-
152
-
153
-
154
 |
 |

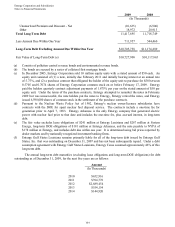
Entergy Corporation and Subsidiaries
Notes to Financial Statements
93
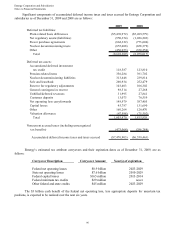
Total income taxes for Entergy Corporation and subsidiaries differ from the amounts computed by applying
the statutory income tax rate to income before taxes. The reasons for the differences for the years 2009, 2008, and
2007 are:
2009 2008 2007
Net income attributable to Entergy Corporation $1,231,092 $1,220,566 $1,134,849
Preferred dividend requirements of subsidiaries 19,958 19,969 25,105
Consolidated net income 1,251,050 1,240,535 1,159,954
Income taxes 632,740 602,998 514,417
Income before income taxes $1,883,790 $1,843,533 $1,674,371
Computed at statutory rate (35%) $659,327 $645,237 $586,030
Increases (reductions) in tax resulting from:
State income taxes net of federal income tax effect 65,241 9,926 31,066
Regulatory differences - utility plant items 57,383 45,543 50,070
Amortization of investment tax credits (16,745) (17,458) (17,612)
Decommissioning trust fund basis (7,917) (417) (35,684)
Capital gains (losses) (28,051) (74,278) 7,126
Flow-through/permanent differences (49,486) 14,656 (49,609)
Tax reserves (17,435) (27,970) (25,821)
Valuation allowance (40,795) 11,770 (8,676)
Other - net 11,218 (4,011) (22,473)
Total income taxes as reported $632,740 $602,998 $514,417
Effective Income Tax Rate 33.6% 32.7% 30.7%
(In Thousands)
In December 2009 an Entergy subsidiary sold Class B preferred shares to a third party for $2.1 million. The
sale resulted in a capital loss for tax purposes of $73.1 million, providing a federal and state net tax benefit of
approximately $28 million that Entergy recorded in the fourth quarter 2009. This amount is included in capital
losses in the table above.
95