Entergy 2009 Annual Report Download - page 135
Download and view the complete annual report
Please find page 135 of the 2009 Entergy annual report below. You can navigate through the pages in the report by either clicking on the pages listed below, or by using the keyword search tool below to find specific information within the annual report.-
 1
1 -
2
-
3
-
4
-
5
-
6
-
7
-
8
-
9
-
10
-
11
-
12
-
13
-
14
-
15
-
16
-
17
-
18
-
19
-
20
-
21
-
22
-
23
-
24
-
25
-
26
-
27
-
28
-
29
-
30
-
31
-
32
-
33
-
34
-
35
-
36
-
37
-
38
-
39
-
40
-
41
-
42
-
43
-
44
-
45
-
46
-
47
-
48
-
49
-
50
-
51
-
52
-
53
-
54
-
55
-
56
-
57
-
58
-
59
-
60
-
61
-
62
-
63
-
64
-
65
-
66
-
67
-
68
-
69
-
70
-
71
-
72
-
73
-
74
-
75
-
76
-
77
-
78
-
79
-
80
-
81
-
82
-
83
-
84
-
85
-
86
-
87
-
88
-
89
-
90
-
91
-
92
-
93
-
94
-
95
-
96
-
97
-
98
-
99
-
100
-
101
-
102
-
103
-
104
-
105
-
106
-
107
-
108
-
109
-
110
-
111
-
112
-
113
-
114
-
115
-
116
-
117
-
118
-
119
-
120
-
121
-
122
-
123
-
124
-
 125
125 -
 126
126 -
 127
127 -
 128
128 -
 129
129 -
 130
130 -
 131
131 -
 132
132 -
 133
133 -
 134
134 -
 135
135 -
 136
136 -
 137
137 -
 138
138 -
 139
139 -
 140
140 -
 141
141 -
 142
142 -
 143
143 -
 144
144 -
 145
145 -
146
-
147
-
148
-
149
-
150
-
151
-
152
-
153
-
154
 |
 |

Entergy Corporation and Subsidiaries
Notes to Financial Statements
131
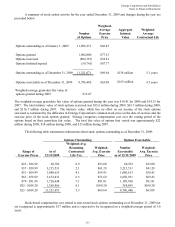
A summary of stock option activity for the year ended December 31, 2009 and changes during the year are
presented below:
Number
of Options
Weighted-
Average
Exercise
Price
Aggregate
Intrinsic
Value
Weighted-
Average
Contractual Life
Options outstanding as of January 1, 2009 11,098,331 $66.45
Options granted 1,084,800 $77.53
Options exercised (802,319) $34.81
Options forfeited/expired (59,741) $87.77
Options outstanding as of December 31, 2009 11,321,071 $69.64 $138 million 5.3 years
Options exercisable as of December 31, 2009 8,786,486 $63.08 $165 million 4.5 years
Weighted
-average grant-date fair value of
options granted during 2009 $12.47
The weighted-average grant-date fair value of options granted during the year was $14.41 for 2008 and $14.15 for
2007. The total intrinsic value of stock options exercised was $35.6 million during 2009, $63.7 million during 2008,
and $116.7 million during 2007. The intrinsic value, which has no effect on net income, of the stock options
exercised is calculated by the difference in Entergy Corporation's common stock price on the date of exercise and the
exercise price of the stock options granted. Entergy recognizes compensation cost over the vesting period of the
options based on their grant-date fair value. The total fair value of options that vested was approximately $22
million during 2009, $18 million during 2008, and $15 million during 2007.
The following table summarizes information about stock options outstanding as of December 31, 2009:
Options Outstanding Options Exercisable
Range of
Exercise Prices
As of
12/31/2009
Weighted-Avg.
Remaining
Contractual
Life-Yrs.
Weighted-
Avg. Exercise
Price
Number
Exercisable
as of 12/31/2009
Weighted-
Avg. Exercise
Price
$23 - $36.99 60,782 0.9 $23.00 60,782 $23.00
$37 - $50.99 3,215,531 2.1 $41.28 3,215,531 $41.28
$51 - $64.99 1,080,613 4.1 $58.43 1,080,613 $58.43
$65 - $78.99 3,674,831 6.5 $71.69 2,650,931 $69.43
$79 - $91.99 1,720,448 7.1 $91.81 1,189,930 $91.81
$92 - $108.20 1,568,866 8.1 $108.20 588,699 $108.20
$23 - $108.20 11,321,071 5.3 $69.64 8,786,486 $63.08
Stock-based compensation cost related to non-vested stock options outstanding as of December 31, 2009 not
yet recognized is approximately $17 million and is expected to be recognized on a weighted-average period of 1.6
years.
133