Entergy 2009 Annual Report Download - page 64
Download and view the complete annual report
Please find page 64 of the 2009 Entergy annual report below. You can navigate through the pages in the report by either clicking on the pages listed below, or by using the keyword search tool below to find specific information within the annual report.-
 1
1 -
2
-
3
-
4
-
5
-
6
-
7
-
8
-
9
-
10
-
11
-
12
-
13
-
14
-
15
-
16
-
17
-
18
-
19
-
20
-
21
-
22
-
23
-
24
-
25
-
26
-
27
-
28
-
29
-
30
-
31
-
32
-
33
-
34
-
35
-
36
-
37
-
38
-
39
-
40
-
41
-
42
-
43
-
44
-
45
-
46
-
47
-
48
-
49
-
50
-
51
-
52
-
53
-
 54
54 -
 55
55 -
 56
56 -
 57
57 -
 58
58 -
 59
59 -
 60
60 -
 61
61 -
 62
62 -
 63
63 -
 64
64 -
 65
65 -
 66
66 -
 67
67 -
 68
68 -
 69
69 -
 70
70 -
 71
71 -
 72
72 -
 73
73 -
 74
74 -
75
-
76
-
77
-
78
-
79
-
80
-
81
-
82
-
83
-
84
-
85
-
86
-
87
-
88
-
89
-
90
-
91
-
92
-
93
-
94
-
95
-
96
-
97
-
98
-
99
-
100
-
101
-
102
-
103
-
104
-
105
-
106
-
107
-
108
-
109
-
110
-
111
-
112
-
113
-
114
-
115
-
116
-
117
-
118
-
119
-
120
-
121
-
122
-
123
-
124
-
125
-
126
-
127
-
128
-
129
-
130
-
131
-
132
-
133
-
134
-
135
-
136
-
137
-
138
-
139
-
140
-
141
-
142
-
143
-
144
-
145
-
146
-
147
-
148
-
149
-
150
-
151
-
152
-
153
-
154
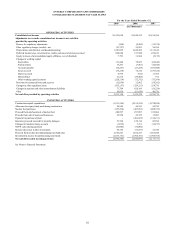
 |
 |

2009 2008 2007
OPERATING ACTIVITIES
Consolidated net income $1,251,050 $1,240,535 $1,159,954
Adjustments to reconcile consolidated net income to net cash flow
provided by operating activities:
Reserve for regulatory adjustments (508) (8,285) (15,574)
Other regulatory charges (credits) - net (21,727) 59,883 54,954
Depreciation, amortization, and decommissioning 1,281,838 1,220,269 1,131,610
Deferred income taxes, investment tax credits, and non-current taxes accrued 864,684 333,948 476,241
Equity in losses of unconsolidated equity affiliates - net of dividends 7,793 11,684 (3,176)
Changes in working capital:
Receivables 116,444 78,653 (62,646)
Fuel inventory 19,291 (7,561) (10,445)
Accounts payable (14,251) (23,225) (103,048)
Taxes accrued (75,210) 75,210 (187,324)
Interest accrued 4,974 (652) 11,785
Deferred fuel 72,314 (38,500) 912
Other working capital accounts (228,210) (72,372) (73,269)
Provision for estimated losses and reserves (12,030) 12,462 (59,292)
Changes in other regulatory assets (415,157) (324,211) 254,736
Changes in pensions and other postretirement liabilities 71,789 828,160 (56,224)
Other 10,074 (61,670) 40,576
Net cash flow provided by operating activities 2,933,158 3,324,328 2,559,770
INVESTING ACTIVITIES
Construction/capital expenditures (1,931,245) (2,212,255) (1,578,030)
Allowance for equity funds used during construction 59,545 44,523 42,742
Nuclear fuel purchases (525,474) (423,951) (408,732)
Proceeds from sale/leaseback of nuclear fuel 284,997 297,097 169,066
Proceeds from sale of assets and businesses 39,554 30,725 13,063
Payment for purchase of plant - (266,823) (336,211)
Insurance proceeds received for property damages 53,760 130,114 83,104
Changes in transition charge account (1,036) 7,211 (19,273)
NYPA value sharing payment (72,000) (72,000) -
Increase (decrease) in other investments 94,154 (72,833) 41,720
Proceeds from nuclear decommissioning trust fund sales 2,570,523 1,652,277 1,583,584
Investment in nuclear decommissioning trust funds (2,667,172) (1,704,181) (1,708,764)
Net cash flow used in investing activities (2,094,394) (2,590,096) (2,117,731)
See Notes to Financial Statements.
ENTERGY CORPORATION AND SUBSIDIARIES
CONSOLIDATED STATEMENTS OF CASH FLOWS
(In Thousands)
For the Years Ended December 31,
62