Entergy 2009 Annual Report Download - page 126
Download and view the complete annual report
Please find page 126 of the 2009 Entergy annual report below. You can navigate through the pages in the report by either clicking on the pages listed below, or by using the keyword search tool below to find specific information within the annual report.-
 1
1 -
2
-
3
-
4
-
5
-
6
-
7
-
8
-
9
-
10
-
11
-
12
-
13
-
14
-
15
-
16
-
17
-
18
-
19
-
20
-
21
-
22
-
23
-
24
-
25
-
26
-
27
-
28
-
29
-
30
-
31
-
32
-
33
-
34
-
35
-
36
-
37
-
38
-
39
-
40
-
41
-
42
-
43
-
44
-
45
-
46
-
47
-
48
-
49
-
50
-
51
-
52
-
53
-
54
-
55
-
56
-
57
-
58
-
59
-
60
-
61
-
62
-
63
-
64
-
65
-
66
-
67
-
68
-
69
-
70
-
71
-
72
-
73
-
74
-
75
-
76
-
77
-
78
-
79
-
80
-
81
-
82
-
83
-
84
-
85
-
86
-
87
-
88
-
89
-
90
-
91
-
92
-
93
-
94
-
95
-
96
-
97
-
98
-
99
-
100
-
101
-
102
-
103
-
104
-
105
-
106
-
107
-
108
-
109
-
110
-
111
-
112
-
113
-
114
-
115
-
 116
116 -
 117
117 -
 118
118 -
 119
119 -
 120
120 -
 121
121 -
 122
122 -
 123
123 -
 124
124 -
 125
125 -
 126
126 -
 127
127 -
 128
128 -
 129
129 -
 130
130 -
 131
131 -
 132
132 -
 133
133 -
 134
134 -
 135
135 -
 136
136 -
137
-
138
-
139
-
140
-
141
-
142
-
143
-
144
-
145
-
146
-
147
-
148
-
149
-
150
-
151
-
152
-
153
-
154
 |
 |

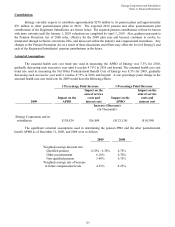
Entergy Corporation and Subsidiaries
Notes to Financial Statements
122
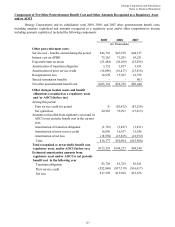
Other Postretirement Benefit Obligations, Plan Assets, Funded Status, and Amounts Not Yet Recognized and
Recognized in the Balance Sheet of Entergy Corporation and its Subsidiaries as of December 31, 2009 and
2008
December 31,
2009 2008
(In Thousands)
Change in APBO
Balance at beginning of year $1,155,072 $1,129,631
Service cost 46,765 47,198
Interest cost 75,265 71,295
Plan amendments -(5,422)
Plan participant contributions 17,394 8,618
Actuarial (gain)/loss 59,537 (33,168)
Benefits paid (79,076) (68,799)
Medicare Part D subsidy received 5,119 5,719
Balance at end of year $1,280,076 $1,155,072
Change in Plan Assets
Fair value of assets at beginning of year $295,908 $350,719
Actual return on plan assets 58,038 (64,350)
Employer contributions 70,135 69,720
Plan participant contributions 17,394 8,618
Acquisition - -
Benefits paid (79,076) (68,799)
Fair value of assets at end of year $362,399 $295,908
Funded status ($917,677) ($859,164)
Amounts recognized in the balance sheet
Current liabilities ($31,189) ($29,594)
Non-current liabilities (886,488) (829,570)
Total funded status ($917,677) ($859,164)
Amounts recognized as a regulatory asset (before tax)
Transition obligation $9,325 $12,436
Prior service cost/(credit) 1,877 (966)
Net loss 239,400 266,086
$250,602 $277,556
Amounts recognized as AOCI (before tax)
Transition obligation $1,862 $2,483
Prior service credit (21,855) (35,108)
Net loss 147,563 114,864
$127,570 $82,239
124