Entergy 2009 Annual Report Download - page 5
Download and view the complete annual report
Please find page 5 of the 2009 Entergy annual report below. You can navigate through the pages in the report by either clicking on the pages listed below, or by using the keyword search tool below to find specific information within the annual report.-
 1
1 -
 2
2 -
 3
3 -
 4
4 -
 5
5 -
 6
6 -
 7
7 -
 8
8 -
 9
9 -
 10
10 -
 11
11 -
 12
12 -
 13
13 -
 14
14 -
 15
15 -
 16
16 -
17
-
18
-
19
-
20
-
21
-
22
-
23
-
24
-
25
-
26
-
27
-
28
-
29
-
30
-
31
-
32
-
33
-
34
-
35
-
36
-
37
-
38
-
39
-
40
-
41
-
42
-
43
-
44
-
45
-
46
-
47
-
48
-
49
-
50
-
51
-
52
-
53
-
54
-
55
-
56
-
57
-
58
-
59
-
60
-
61
-
62
-
63
-
64
-
65
-
66
-
67
-
68
-
69
-
70
-
71
-
72
-
73
-
74
-
75
-
76
-
77
-
78
-
79
-
80
-
81
-
82
-
83
-
84
-
85
-
86
-
87
-
88
-
89
-
90
-
91
-
92
-
93
-
94
-
95
-
96
-
97
-
98
-
99
-
100
-
101
-
102
-
103
-
104
-
105
-
106
-
107
-
108
-
109
-
110
-
111
-
112
-
113
-
114
-
115
-
116
-
117
-
118
-
119
-
120
-
121
-
122
-
123
-
124
-
125
-
126
-
127
-
128
-
129
-
130
-
131
-
132
-
133
-
134
-
135
-
136
-
137
-
138
-
139
-
140
-
141
-
142
-
143
-
144
-
145
-
146
-
147
-
148
-
149
-
150
-
151
-
152
-
153
-
154
 |
 |

Entergy Corporation and Subsidiaries
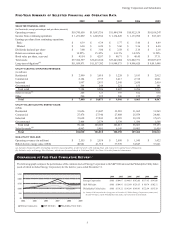
FI V E -YE A R SU M M A R Y O F SE L E C T E D FI N A N C I A L A N D OP E R A T I N G DA T A
2009 2008 2007 2006 2005
SELECTED FINANCIAL DATA:
(inthousands,exceptpercentagesandpershareamounts)
Operating revenues $10,745,650 $13,093,756 $ 11,484,398 $ 10,932,158 $10,106,247
Income from continuing operations $ 1,231,092 $ 1,220,566 $ 1,134,849 $ 1,133,098 $ 943,125
Earnings per share from continuing operations:
Basic $ 6.39 $ 6.39 $ 5.77 $ 5.46 $ 4.49
Diluted $ 6.30 $ 6.20 $ 5.60 $ 5.36 $ 4.40
Dividends declared per share $ 3.00 $ 3.00 $ 2.58 $ 2.16 $ 2.16
Return on common equity 14.85% 15.42% 14.13% 14.21% 11.20%
Book value per share, year-end $ 45.54 $ 42.07 $ 40.71 $ 40.45 $ 37.31
Total assets $37,364,597 $ 36,616,818 $ 33,643,002 $ 31,082,731 $ 30,857,657
Long-term obligations(a) $11,059,971 $ 11,517,382 $ 9,948,573 $ 8,996,620 $ 9,013,448
UTILITY ELECTRIC OPERATING REVENUES:
(inmillions)
Residential $ 2,999 $ 3,610 $ 3,228 $ 3,193 $ 2,912
Commercial 2,184 2,735 2,413 2,318 2,041
Industrial 1,997 2,933 2,545 2,630 2,419
Governmental 204 248 221 155 141
Total retail 7,384 9,526 8,407 8,296 7,513
Sales for resale(b) 206 325 393 612 656
Other 290 222 246 155 278
Total $ 7,880 $ 10,073 $ 9,046 $ 9,063 $ 8,447
UTILITY BILLED ELECTRIC ENERGY SALES:
(GWh)
Residential 33,626 33,047 33,281 31,665 31,569
Commercial 27,476 27,340 27,408 25,079 24,401
Industrial 35,638 37,843 38,985 38,339 37,615
Governmental 2,408 2,379 2,339 1,580 1,568
Total retail 99,148 100,609 102,013 96,663 95,153
Sales for resale(b) 4,862 5,401 6,145 10,803 11,459
Total 104,010 106,010 108,158 107,466 106,612
NON-UTILITY NUCLEAR:
Operating revenues (inmillions) $ 2,555 $ 2,558 $ 2,030 $ 1,545 $ 1,422
Billed electric energy sales (GWh) 40,981 41,710 37,570 34,847 33,641
(a) Includes long-term debt (excluding currently maturing debt), preferred stock with sinking fund, and noncurrent capital lease obligations.
(b) Includes sales to Entergy New Orleans, which was deconsolidated in 2006 and 2005. See Note 18 to the financial statements.
CO M P A R I S O N O F FI V E -YE A R CU M U L A T I V E RE T U R N (a)
The following graph compares the performance of the common stock of Entergy Corporation to the S&P 500 Index and the Philadelphia Utility Index
(eachofwhichincludesEntergyCorporation)forthelastveyearsendedDecember31.
2004 2005 2006 2007 2008 2009
Entergy Corporation $100 $104.67 $144.85 $192.00 $137.65 $141.00
S&P 500 Index $100 $104.91 $121.48 $128.15 $ 80.74 $102.11
Philadelphia Utility Index $100 $118.22 $141.90 $168.83 $122.84 $135.18
(a) Assumes $100 invested at the closing price on December 31, 2004 in Entergy Corporation common stock,
the S&P 500 Index, and the Philadelphia Utility Index, and reinvestment of all dividends.
$250
$200
$150
$100
$50
$0
2004 2005 2006 2007 2008 2009
Entergy Corporation S&P 500 Index Philadelphia Utility Index
3