Entergy 2009 Annual Report Download - page 20
Download and view the complete annual report
Please find page 20 of the 2009 Entergy annual report below. You can navigate through the pages in the report by either clicking on the pages listed below, or by using the keyword search tool below to find specific information within the annual report.-
 1
1 -
2
-
3
-
4
-
5
-
6
-
7
-
8
-
9
-
 10
10 -
 11
11 -
 12
12 -
 13
13 -
 14
14 -
 15
15 -
 16
16 -
 17
17 -
 18
18 -
 19
19 -
 20
20 -
 21
21 -
 22
22 -
 23
23 -
 24
24 -
 25
25 -
 26
26 -
 27
27 -
 28
28 -
 29
29 -
 30
30 -
31
-
32
-
33
-
34
-
35
-
36
-
37
-
38
-
39
-
40
-
41
-
42
-
43
-
44
-
45
-
46
-
47
-
48
-
49
-
50
-
51
-
52
-
53
-
54
-
55
-
56
-
57
-
58
-
59
-
60
-
61
-
62
-
63
-
64
-
65
-
66
-
67
-
68
-
69
-
70
-
71
-
72
-
73
-
74
-
75
-
76
-
77
-
78
-
79
-
80
-
81
-
82
-
83
-
84
-
85
-
86
-
87
-
88
-
89
-
90
-
91
-
92
-
93
-
94
-
95
-
96
-
97
-
98
-
99
-
100
-
101
-
102
-
103
-
104
-
105
-
106
-
107
-
108
-
109
-
110
-
111
-
112
-
113
-
114
-
115
-
116
-
117
-
118
-
119
-
120
-
121
-
122
-
123
-
124
-
125
-
126
-
127
-
128
-
129
-
130
-
131
-
132
-
133
-
134
-
135
-
136
-
137
-
138
-
139
-
140
-
141
-
142
-
143
-
144
-
145
-
146
-
147
-
148
-
149
-
150
-
151
-
152
-
153
-
154
 |
 |

Entergy Corporation and Subsidiaries
Management's Financial Discussion and Analysis
16
2008 Compared to 2007
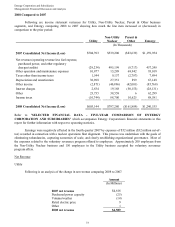
Following are income statement variances for Utility, Non-Utility Nuclear, Parent & Other business
segments, and Entergy comparing 2008 to 2007 showing how much the line item increased or (decreased) in
comparison to the prior period:
Utility
Non-Utility
Nuclear
Parent &
Other Entergy
(In Thousands)
2007 Consolidated Net Income (Loss) $704,393 $539,200 ($83,639) $1,159,954
Net revenue (operating revenue less fuel expense,
purchased power, and other regulatory
charges/credits) (29,234) 495,199 (8,717) 457,248
Other operation and maintenance expenses 10,877 13,289 68,942 93,108
Taxes other than income taxes 1,544 9,137 (2,787) 7,894
Depreciation and amortization 38,898 27,351 899 67,148
Other income (2,871) (40,896) (42,001) (85,768)
Interest charges 2,834 19,188 (50,153) (28,131)
Other 23,735 38,558 6 62,299
Income taxes (10,744) 88,700 10,625 88,581
2008 Consolidated Net Income (Loss) $605,144 $797,280 ($161,889) $1,240,535
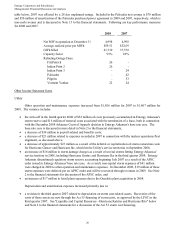
Refer to "SELECTED FINANCIAL DATA - FIVE-YEAR COMPARISON OF ENTERGY
CORPORATION AND SUBSIDIARIES" which accompanies Entergy Corporation's financial statements in this
report for further information with respect to operating statistics.
Earnings were negatively affected in the fourth quarter 2007 by expenses of $52 million ($32 million net-of-
tax) recorded in connection with a nuclear operations fleet alignment. This process was undertaken with the goals of
eliminating redundancies, capturing economies of scale, and clearly establishing organizational governance. Most of
the expenses related to the voluntary severance program offered to employees. Approximately 200 employees from
the Non-Utility Nuclear business and 150 employees in the Utility business accepted the voluntary severance
program offers.
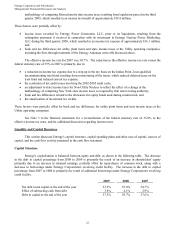
Net Revenue
Utility
Following is an analysis of the change in net revenue comparing 2008 to 2007.
Amount
(In Millions)
2007 net revenue $4,618
Purchased power capacity (25)
Volume/weather (14)
Retail electric price 9
Other 1
2008 net revenue $4,589
18