Entergy 2009 Annual Report Download - page 146
Download and view the complete annual report
Please find page 146 of the 2009 Entergy annual report below. You can navigate through the pages in the report by either clicking on the pages listed below, or by using the keyword search tool below to find specific information within the annual report.-
 1
1 -
2
-
3
-
4
-
5
-
6
-
7
-
8
-
9
-
10
-
11
-
12
-
13
-
14
-
15
-
16
-
17
-
18
-
19
-
20
-
21
-
22
-
23
-
24
-
25
-
26
-
27
-
28
-
29
-
30
-
31
-
32
-
33
-
34
-
35
-
36
-
37
-
38
-
39
-
40
-
41
-
42
-
43
-
44
-
45
-
46
-
47
-
48
-
49
-
50
-
51
-
52
-
53
-
54
-
55
-
56
-
57
-
58
-
59
-
60
-
61
-
62
-
63
-
64
-
65
-
66
-
67
-
68
-
69
-
70
-
71
-
72
-
73
-
74
-
75
-
76
-
77
-
78
-
79
-
80
-
81
-
82
-
83
-
84
-
85
-
86
-
87
-
88
-
89
-
90
-
91
-
92
-
93
-
94
-
95
-
96
-
97
-
98
-
99
-
100
-
101
-
102
-
103
-
104
-
105
-
106
-
107
-
108
-
109
-
110
-
111
-
112
-
113
-
114
-
115
-
116
-
117
-
118
-
119
-
120
-
121
-
122
-
123
-
124
-
125
-
126
-
127
-
128
-
129
-
130
-
131
-
132
-
133
-
134
-
135
-
 136
136 -
 137
137 -
 138
138 -
 139
139 -
 140
140 -
 141
141 -
 142
142 -
 143
143 -
 144
144 -
 145
145 -
 146
146 -
 147
147 -
 148
148 -
 149
149 -
 150
150 -
 151
151 -
 152
152 -
 153
153 -
 154
154
 |
 |

Entergy Corporation and Subsidiaries
Notes to Financial Statements
142
derivative assets or liabilities are based on the estimated amount that the contracts are in-the-money at the balance
sheet date (treated as an asset) or out-of-the-money at the balance sheet date (treated as a liability) and would equal
the estimated amount receivable or payable by Entergy if the contracts were settled at that date. These derivative
contracts include cash flow hedges that swap fixed for floating cash flows for sales of the output from Entergy's Non-
Utility Nuclear business. The fair values are based on the mark-to-market comparison between the fixed contract
prices and the floating prices determined each period from a combination of quoted forward power market prices for
the period for which such curves are available, and model-generated prices using quoted forward gas market curves
and estimates regarding heat rates to convert gas to power and the costs associated with the transportation of the
power from the plants' bus bar to the contract's point of delivery, generally a power market hub, for the period
thereafter. The difference between the fixed price in the swap contract and these market-related prices multiplied by
the volume specified in the contract and discounted at the counterparties' credit adjusted risk free rate are recorded as
derivative contract assets or liabilities. $202 million of cash flow hedges as of December 31, 2009 are in-the-money
contracts with counterparties who are all currently investment grade. $2 million of the cash flow hedges as of
December 31, 2009 are out-of-the-money contracts supported by corporate guarantees, which would require
additional cash or letters of credit in the event of a decrease in Entergy Corporation’ s credit rating to below
investment grade.
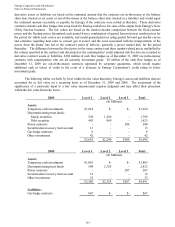
The following tables set forth, by level within the fair value hierarchy, Entergy's assets and liabilities that are
accounted for at fair value on a recurring basis as of December 31, 2009 and 2008. The assessment of the
significance of a particular input to a fair value measurement requires judgment and may affect their placement
within the fair value hierarchy levels.
2009 Level 1 Level 2 Level 3 Total
(In Millions)
Assets:
Temporary cash investments $1,624 $- $- $1,624
Decommissioning trust funds:
Equity securities 528 1,260 - 1,788
Debt securities 443 980 - 1,423
Power contracts - - 200 200
Securitization recovery trust account 13 - - 13
Gas hedge contracts 8 - - 8
Other investments 42 - - 42
$2,658 $2,240 $200 $5,098
2008 Level 1 Level 2 Level 3 Total
(In Millions)
Assets:
Temporary cash investments $1,805 $- $- $1,805
Decommissioning trust funds 508 2,324 - 2,832
Power contracts - -207 207
Securitization recovery trust account 12 - - 12
Other investments 35 - - 35
$2,360 $2,324 $207 $4,891
Liabilities:
Gas hedge contracts $67 $- $- $67
144