Entergy 2009 Annual Report Download - page 16
Download and view the complete annual report
Please find page 16 of the 2009 Entergy annual report below. You can navigate through the pages in the report by either clicking on the pages listed below, or by using the keyword search tool below to find specific information within the annual report.-
 1
1 -
2
-
3
-
4
-
5
-
 6
6 -
 7
7 -
 8
8 -
 9
9 -
 10
10 -
 11
11 -
 12
12 -
 13
13 -
 14
14 -
 15
15 -
 16
16 -
 17
17 -
 18
18 -
 19
19 -
 20
20 -
 21
21 -
 22
22 -
 23
23 -
 24
24 -
 25
25 -
 26
26 -
27
-
28
-
29
-
30
-
31
-
32
-
33
-
34
-
35
-
36
-
37
-
38
-
39
-
40
-
41
-
42
-
43
-
44
-
45
-
46
-
47
-
48
-
49
-
50
-
51
-
52
-
53
-
54
-
55
-
56
-
57
-
58
-
59
-
60
-
61
-
62
-
63
-
64
-
65
-
66
-
67
-
68
-
69
-
70
-
71
-
72
-
73
-
74
-
75
-
76
-
77
-
78
-
79
-
80
-
81
-
82
-
83
-
84
-
85
-
86
-
87
-
88
-
89
-
90
-
91
-
92
-
93
-
94
-
95
-
96
-
97
-
98
-
99
-
100
-
101
-
102
-
103
-
104
-
105
-
106
-
107
-
108
-
109
-
110
-
111
-
112
-
113
-
114
-
115
-
116
-
117
-
118
-
119
-
120
-
121
-
122
-
123
-
124
-
125
-
126
-
127
-
128
-
129
-
130
-
131
-
132
-
133
-
134
-
135
-
136
-
137
-
138
-
139
-
140
-
141
-
142
-
143
-
144
-
145
-
146
-
147
-
148
-
149
-
150
-
151
-
152
-
153
-
154
 |
 |

Entergy Corporation and Subsidiaries
Management's Financial Discussion and Analysis
12
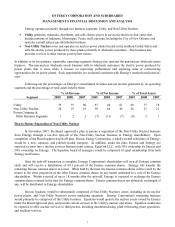
Non-Utility Nuclear
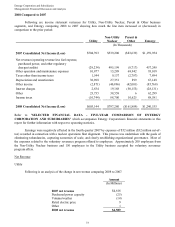
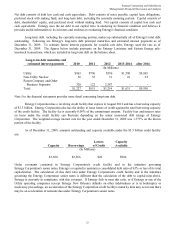
Following is an analysis of the change in net revenue comparing 2009 to 2008.
Amount
(In Millions)
2008 net revenue $2,334
Volume variance (53)
Palisades purchased power amortization (23)
Realized price changes 67
Other (2)
2009 net revenue $2,323
As shown in the table above, net revenue for Non-Utility Nuclear decreased slightly by $11 million, or 0.5%,
in 2009 compared to 2008. Higher pricing in its contracts to sell power was partially offset by lower volume
resulting from more refueling outage days in 2009 compared to 2008. Included in net revenue is $53 million and $76
million of amortization of the Palisades purchased power agreement in 2009 and 2008, respectively, which is non-
cash revenue and is discussed in Note 15 to the financial statements. Following are key performance measures for
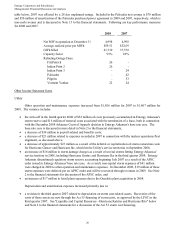
2009 and 2008:
2009 2008
Net MW in operation at December 31 4,998 4,998
Average realized price per MWh $61.07 $59.51
GWh billed 40,981 41,710
Capacity factor 93% 95%
Refueling Outage Days:
FitzPatrick - 26
Indian Point 2 - 26
Indian Point 3 36 -
Palisades 41 -
Pilgrim 31 -
Vermont Yankee - 22
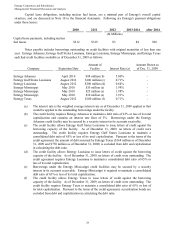
Realized Price per MWh
When Non-Utility Nuclear acquired its six nuclear power plants it also entered into purchased power
agreements with each of the sellers. For four of the plants, the 688 MW Pilgrim, 838 MW FitzPatrick, 1,028 MW
Indian Point 2, and 1,041 MW Indian Point 3 plants, the original purchased power agreements with the sellers
expired in 2004. The purchased power agreement with the seller of the 605 MW Vermont Yankee plant extends into
2012, and the purchased power agreement with the seller of the 798 MW Palisades plant extends into 2022. Market
prices in the New York and New England power markets, where the four plants with original purchased power
agreements that expired in 2004 are located, increased since the purchase of these plants, and the contracts that Non-
Utility Nuclear entered into after the original contracts expired, as well as realized day ahead and spot market sales,
have generally been at higher prices than the original contracts. Non-Utility Nuclear's annual average realized price
per MWh increased from $39.40 for 2003 to $61.07 for 2009. Power prices increased in the period from 2003
through 2008 primarily because of increases in the price of natural gas. Natural gas prices increased in the period
from 2003 through 2008 primarily because of rising production costs and limited imports of liquefied natural gas,
both caused by global demand and increases in the price of crude oil. In addition, increases in the price of power
during this period were caused secondarily by rising heat rates, which in turn were caused primarily by load growth
14