Entergy 2009 Annual Report Download - page 14
Download and view the complete annual report
Please find page 14 of the 2009 Entergy annual report below. You can navigate through the pages in the report by either clicking on the pages listed below, or by using the keyword search tool below to find specific information within the annual report.-
 1
1 -
2
-
3
-
 4
4 -
 5
5 -
 6
6 -
 7
7 -
 8
8 -
 9
9 -
 10
10 -
 11
11 -
 12
12 -
 13
13 -
 14
14 -
 15
15 -
 16
16 -
 17
17 -
 18
18 -
 19
19 -
 20
20 -
 21
21 -
 22
22 -
 23
23 -
 24
24 -
25
-
26
-
27
-
28
-
29
-
30
-
31
-
32
-
33
-
34
-
35
-
36
-
37
-
38
-
39
-
40
-
41
-
42
-
43
-
44
-
45
-
46
-
47
-
48
-
49
-
50
-
51
-
52
-
53
-
54
-
55
-
56
-
57
-
58
-
59
-
60
-
61
-
62
-
63
-
64
-
65
-
66
-
67
-
68
-
69
-
70
-
71
-
72
-
73
-
74
-
75
-
76
-
77
-
78
-
79
-
80
-
81
-
82
-
83
-
84
-
85
-
86
-
87
-
88
-
89
-
90
-
91
-
92
-
93
-
94
-
95
-
96
-
97
-
98
-
99
-
100
-
101
-
102
-
103
-
104
-
105
-
106
-
107
-
108
-
109
-
110
-
111
-
112
-
113
-
114
-
115
-
116
-
117
-
118
-
119
-
120
-
121
-
122
-
123
-
124
-
125
-
126
-
127
-
128
-
129
-
130
-
131
-
132
-
133
-
134
-
135
-
136
-
137
-
138
-
139
-
140
-
141
-
142
-
143
-
144
-
145
-
146
-
147
-
148
-
149
-
150
-
151
-
152
-
153
-
154
 |
 |

Entergy Corporation and Subsidiaries
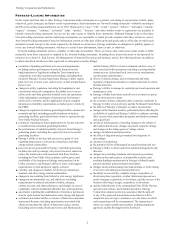
Management's Financial Discussion and Analysis
10
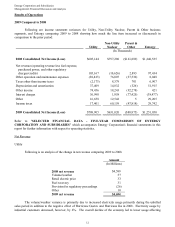
Results of Operations
2009 Compared to 2008
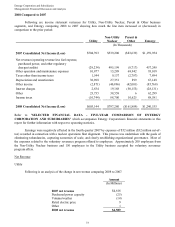
Following are income statement variances for Utility, Non-Utility Nuclear, Parent & Other business
segments, and Entergy comparing 2009 to 2008 showing how much the line item increased or (decreased) in
comparison to the prior period:
Utility
Non-Utility
Nuclear
Parent &
Other Entergy
(In Thousands)
2008 Consolidated Net Income (Loss) $605,144 $797,280 ($161,889) $1,240,535
Net revenue (operating revenue less fuel expense,
purchased power, and other regulatory
charges/credits) 105,167 (10,626) 2,893 97,434
Other operation and maintenance expenses (30,423) 76,007 (37,536) 8,048
Taxes other than income taxes (2,173) 8,379 701 6,907
Depreciation and amortization 37,409 14,832 (326) 51,915
Other income 74,456 18,243 (92,278) 421
Interest charges 36,990 1,958 (77,425) (38,477)
Other 16,658 12,542 5 29,205
Income taxes 17,401 60,159 (47,818) 29,742
2009 Consolidated Net Income (Loss) $708,905 $631,020 ($88,875) $1,251,050
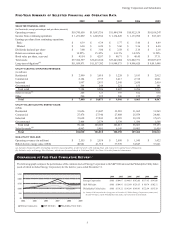
Refer to "SELECTED FINANCIAL DATA - FIVE-YEAR COMPARISON OF ENTERGY
CORPORATION AND SUBSIDIARIES" which accompanies Entergy Corporation's financial statements in this
report for further information with respect to operating statistics.
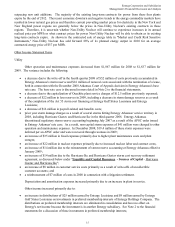
Net Revenue
Utility
Following is an analysis of the change in net revenue comparing 2009 to 2008.
Amount
(In Millions)
2008 net revenue $4,589
Volume/weather 57
Retail electric price 33
Fuel recovery 31
Provision for regulatory proceedings (26)
Other 10
2009 net revenue $4,694
The volume/weather variance is primarily due to increased electricity usage primarily during the unbilled
sales period in addition to the negative effect of Hurricane Gustav and Hurricane Ike in 2008. Electricity usage by
industrial customers decreased, however, by 6%. The overall decline of the economy led to lower usage affecting
12