Entergy 2009 Annual Report Download - page 128
Download and view the complete annual report
Please find page 128 of the 2009 Entergy annual report below. You can navigate through the pages in the report by either clicking on the pages listed below, or by using the keyword search tool below to find specific information within the annual report.-
 1
1 -
2
-
3
-
4
-
5
-
6
-
7
-
8
-
9
-
10
-
11
-
12
-
13
-
14
-
15
-
16
-
17
-
18
-
19
-
20
-
21
-
22
-
23
-
24
-
25
-
26
-
27
-
28
-
29
-
30
-
31
-
32
-
33
-
34
-
35
-
36
-
37
-
38
-
39
-
40
-
41
-
42
-
43
-
44
-
45
-
46
-
47
-
48
-
49
-
50
-
51
-
52
-
53
-
54
-
55
-
56
-
57
-
58
-
59
-
60
-
61
-
62
-
63
-
64
-
65
-
66
-
67
-
68
-
69
-
70
-
71
-
72
-
73
-
74
-
75
-
76
-
77
-
78
-
79
-
80
-
81
-
82
-
83
-
84
-
85
-
86
-
87
-
88
-
89
-
90
-
91
-
92
-
93
-
94
-
95
-
96
-
97
-
98
-
99
-
100
-
101
-
102
-
103
-
104
-
105
-
106
-
107
-
108
-
109
-
110
-
111
-
112
-
113
-
114
-
115
-
116
-
117
-
 118
118 -
 119
119 -
 120
120 -
 121
121 -
 122
122 -
 123
123 -
 124
124 -
 125
125 -
 126
126 -
 127
127 -
 128
128 -
 129
129 -
 130
130 -
 131
131 -
 132
132 -
 133
133 -
 134
134 -
 135
135 -
 136
136 -
 137
137 -
 138
138 -
139
-
140
-
141
-
142
-
143
-
144
-
145
-
146
-
147
-
148
-
149
-
150
-
151
-
152
-
153
-
154
 |
 |

Entergy Corporation and Subsidiaries
Notes to Financial Statements
124
income tax, the long term rate of return for taxable postretirement trust assets is expected to be 5.5% for 2010 (6%
for 2009) annually.
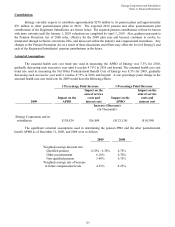
Since precise allocation targets are inefficient to manage security investments, the following ranges were
established to produce an acceptable economically efficient plan to manage around the targets:
Pension Postretirement
Non
-
Taxable
Taxable
Domestic Equity Securities 35% to 55% 33% to 43% 30% to 40%
International Equity Securities 15% to 25% 12% to 22% 0%
Total Equity 60% to 70% 50% to 60% 30% to 40%
Fixed Income Securities 25% to 35% 40% to 50% 60% to 70%
Other 0% to 10% 0% to 5% 0% to 5%
Concentrations of Credit Risk
Entergy’ s investment guidelines mandate the avoidance of risk concentrations. Types of concentrations
specified to be avoided include, but are not limited to, investment concentrations in a single entity, type of industry,
foreign country, geographic area and individual security issuance. As of December 31, 2009 all investment managers
and assets were materially in compliance with the approved investment guidelines, therefore there were no significant
concentrations (defined as greater than 10 percent of plan assets) of risk in Entergy’ s pension and other
postretirement benefit plan assets.
Fair Value Measurements
For fiscal years ending after December 31, 2009, fair value measurements and disclosures for plan assets are
required.
Fair value of a financial instrument is the amount that would be received to sell an asset or paid to transfer
a liability in an orderly transaction between market participants at the measurement date. Interest bearing cash,
treasury notes and bonds, and common stocks are stated at fair value determined by quoted market prices. Fixed
income securities (corporate, government, and securitized), are stated at fair value as determined by broker quotes.
Common collective investment trust funds and registered investment company trust funds are stated at estimated fair
value based on the fair market value of the underlying investments. The unallocated insurance contract investments
are recorded at contract value, which approximates fair value. The contract value represents contributions made
under the contract, plus interest, less funds used to pay benefits and contract expenses, and less distributions to the
Master Trust. The other remaining assets are U.S. municipal and foreign government bonds stated at fair value as
determined by broker quotes.
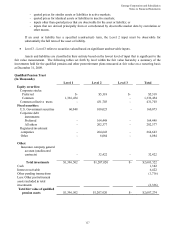
The classification levels for fair value are as follows:
Level 1 - Level 1 inputs are unadjusted quoted prices for identical assets or liabilities in active markets that
the Plan has the ability to access at the measurement date. Active markets are those in which transactions for
the asset or liability occur in sufficient frequency and volume to provide pricing information on an ongoing
basis.
Level 2 - Level 2 inputs are inputs other than quoted prices included in Level 1 that are, either directly or
indirectly, observable for the asset or liability at the measurement date. Assets are valued based on prices
derived by an independent party that uses inputs such as benchmark yields, reported trades, broker/dealer
quotes, and issuer spreads. Level 2 inputs include the following:
126