Entergy 2009 Annual Report Download - page 125
Download and view the complete annual report
Please find page 125 of the 2009 Entergy annual report below. You can navigate through the pages in the report by either clicking on the pages listed below, or by using the keyword search tool below to find specific information within the annual report.-
 1
1 -
2
-
3
-
4
-
5
-
6
-
7
-
8
-
9
-
10
-
11
-
12
-
13
-
14
-
15
-
16
-
17
-
18
-
19
-
20
-
21
-
22
-
23
-
24
-
25
-
26
-
27
-
28
-
29
-
30
-
31
-
32
-
33
-
34
-
35
-
36
-
37
-
38
-
39
-
40
-
41
-
42
-
43
-
44
-
45
-
46
-
47
-
48
-
49
-
50
-
51
-
52
-
53
-
54
-
55
-
56
-
57
-
58
-
59
-
60
-
61
-
62
-
63
-
64
-
65
-
66
-
67
-
68
-
69
-
70
-
71
-
72
-
73
-
74
-
75
-
76
-
77
-
78
-
79
-
80
-
81
-
82
-
83
-
84
-
85
-
86
-
87
-
88
-
89
-
90
-
91
-
92
-
93
-
94
-
95
-
96
-
97
-
98
-
99
-
100
-
101
-
102
-
103
-
104
-
105
-
106
-
107
-
108
-
109
-
110
-
111
-
112
-
113
-
114
-
 115
115 -
 116
116 -
 117
117 -
 118
118 -
 119
119 -
 120
120 -
 121
121 -
 122
122 -
 123
123 -
 124
124 -
 125
125 -
 126
126 -
 127
127 -
 128
128 -
 129
129 -
 130
130 -
 131
131 -
 132
132 -
 133
133 -
 134
134 -
 135
135 -
136
-
137
-
138
-
139
-
140
-
141
-
142
-
143
-
144
-
145
-
146
-
147
-
148
-
149
-
150
-
151
-
152
-
153
-
154
 |
 |

Entergy Corporation and Subsidiaries
Notes to Financial Statements
121
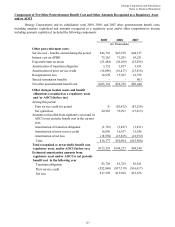
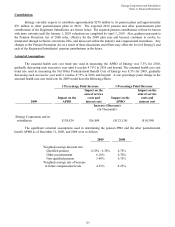
Components of Net Other Postretirement Benefit Cost and Other Amounts Recognized as a Regulatory Asset
and/or AOCI
Entergy Corporation's and its subsidiaries' total 2009, 2008, and 2007 other postretirement benefit costs,
including amounts capitalized and amounts recognized as a regulatory asset and/or other comprehensive income,
including amounts capitalized, included the following components:
2009 2008 2007
(In Thousands)
Other post retirement costs:
Service cost - benefits earned during the period $46,765 $47,198 $44,137
Interest cost on APBO 75,265 71,295 63,231
Expected return on assets (23,484) (28,109) (25,298)
Amortization of transition obligation 3,732 3,827 3,831
Amortization of prior service credit (16,096) (16,417) (15,836)
Recognized net loss 18,970 15,565 18,972
Special termination benefits - - 603
Net other postretirement benefit cost $105,152 $93,359 $89,640
Other changes in plan assets and benefit
obligations recognized as a regulatory asset
and /or AOCI (before tax)
Arising this period:
Prior service credit for period $- ($5,422) ($3,520)
Net (gain)/loss 24,983 59,291 (15,013)
Amounts reclassified from regulatory asset and /or
AOCI to net periodic benefit cost in the current
year:
Amortization of transition obligation (3,732) (3,827) (3,831)
Amortization of prior service credit 16,096 16,417 15,836
Amortization of net loss (18,970) (15,565) (18,972)
Total $18,377 $50,894 ($25,500)
Total recognized as net periodic benefit cost,
regulatory asset, and/or AOCI (before tax) $123,529 $144,253 $64,140
Estimated amortization amounts from
regulatory asset and/or AOCI to net periodic
benefit cost in the following year
Transition obligation $3,728 $3,729 $3,831
Prior service credit ($12,060) ($17,519) ($16,417)
Net loss $17,270 $19,018 $15,676
123