Entergy 2009 Annual Report Download - page 148
Download and view the complete annual report
Please find page 148 of the 2009 Entergy annual report below. You can navigate through the pages in the report by either clicking on the pages listed below, or by using the keyword search tool below to find specific information within the annual report.-
 1
1 -
2
-
3
-
4
-
5
-
6
-
7
-
8
-
9
-
10
-
11
-
12
-
13
-
14
-
15
-
16
-
17
-
18
-
19
-
20
-
21
-
22
-
23
-
24
-
25
-
26
-
27
-
28
-
29
-
30
-
31
-
32
-
33
-
34
-
35
-
36
-
37
-
38
-
39
-
40
-
41
-
42
-
43
-
44
-
45
-
46
-
47
-
48
-
49
-
50
-
51
-
52
-
53
-
54
-
55
-
56
-
57
-
58
-
59
-
60
-
61
-
62
-
63
-
64
-
65
-
66
-
67
-
68
-
69
-
70
-
71
-
72
-
73
-
74
-
75
-
76
-
77
-
78
-
79
-
80
-
81
-
82
-
83
-
84
-
85
-
86
-
87
-
88
-
89
-
90
-
91
-
92
-
93
-
94
-
95
-
96
-
97
-
98
-
99
-
100
-
101
-
102
-
103
-
104
-
105
-
106
-
107
-
108
-
109
-
110
-
111
-
112
-
113
-
114
-
115
-
116
-
117
-
118
-
119
-
120
-
121
-
122
-
123
-
124
-
125
-
126
-
127
-
128
-
129
-
130
-
131
-
132
-
133
-
134
-
135
-
136
-
137
-
 138
138 -
 139
139 -
 140
140 -
 141
141 -
 142
142 -
 143
143 -
 144
144 -
 145
145 -
 146
146 -
 147
147 -
 148
148 -
 149
149 -
 150
150 -
 151
151 -
 152
152 -
 153
153 -
 154
154
 |
 |

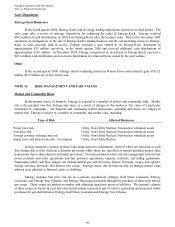
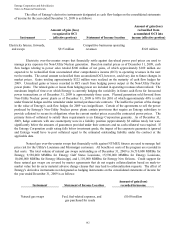
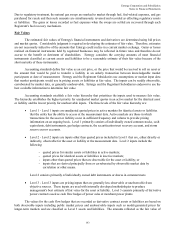
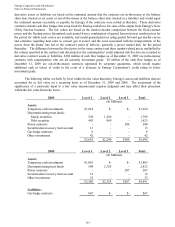
Entergy Corporation and Subsidiaries
Notes to Financial Statements
144
The securities held as of December 31, 2009 and 2008 are summarized as follows:
Fair
Value
Total
Unrealized
Gains
Total
Unrealized
Losses
(In Millions)
2009
Equity Securities $1,788 $311 $30
Debt Securities 1,423 63 8
Total $3,211 $374 $38
2008
Equity Securities $1,436 $85 $177
Debt Securities 1,396 77 21
Total $2,832 $162 $198
The amortized cost of debt securities was $1,368 million as of December 31, 2009 and $1,340 million as of
December 31, 2008. As of December 31, 2009, the debt securities have an average coupon rate of approximately
4.68%, an average duration of approximately 5.08 years, and an average maturity of approximately 8.3 years. The
equity securities are generally held in funds that are designed to approximate or somewhat exceed the return of the
Standard & Poor's 500 Index. A relatively small percentage of the securities are held in funds intended to replicate
the return of the Wilshire 4500 Index or the Russell 3000 Index.
The fair value and gross unrealized losses of available-for-sale equity and debt securities, summarized by
investment type and length of time that the securities have been in a continuous loss position, are as follows as of
December 31, 2009:
Equity Securities Debt Securities
Fair
Value
Gross
Unrealized
Losses
Fair
Value
Gross
Unrealized
Losses
(In Millions)
Less than 12 months $57 $1 $311 $6
More than 12 months 205 29 18 2
Total $262 $30 $329 $8
The unrealized losses in excess of twelve months above relate to Entergy's Utility operating companies and System
Energy.
146