Entergy 2009 Annual Report Download - page 21
Download and view the complete annual report
Please find page 21 of the 2009 Entergy annual report below. You can navigate through the pages in the report by either clicking on the pages listed below, or by using the keyword search tool below to find specific information within the annual report.-
 1
1 -
2
-
3
-
4
-
5
-
6
-
7
-
8
-
9
-
10
-
 11
11 -
 12
12 -
 13
13 -
 14
14 -
 15
15 -
 16
16 -
 17
17 -
 18
18 -
 19
19 -
 20
20 -
 21
21 -
 22
22 -
 23
23 -
 24
24 -
 25
25 -
 26
26 -
 27
27 -
 28
28 -
 29
29 -
 30
30 -
 31
31 -
32
-
33
-
34
-
35
-
36
-
37
-
38
-
39
-
40
-
41
-
42
-
43
-
44
-
45
-
46
-
47
-
48
-
49
-
50
-
51
-
52
-
53
-
54
-
55
-
56
-
57
-
58
-
59
-
60
-
61
-
62
-
63
-
64
-
65
-
66
-
67
-
68
-
69
-
70
-
71
-
72
-
73
-
74
-
75
-
76
-
77
-
78
-
79
-
80
-
81
-
82
-
83
-
84
-
85
-
86
-
87
-
88
-
89
-
90
-
91
-
92
-
93
-
94
-
95
-
96
-
97
-
98
-
99
-
100
-
101
-
102
-
103
-
104
-
105
-
106
-
107
-
108
-
109
-
110
-
111
-
112
-
113
-
114
-
115
-
116
-
117
-
118
-
119
-
120
-
121
-
122
-
123
-
124
-
125
-
126
-
127
-
128
-
129
-
130
-
131
-
132
-
133
-
134
-
135
-
136
-
137
-
138
-
139
-
140
-
141
-
142
-
143
-
144
-
145
-
146
-
147
-
148
-
149
-
150
-
151
-
152
-
153
-
154
 |
 |

Entergy Corporation and Subsidiaries
Management's Financial Discussion and Analysis
17
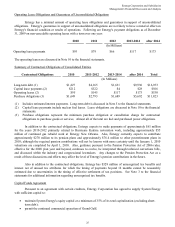
The purchased power capacity variance is primarily due to higher capacity charges. A portion of the
variance is due to the amortization of deferred capacity costs and is offset in base revenues due to base rate increases
implemented to recover incremental deferred and ongoing purchased power capacity charges.
The volume/weather variance is primarily due to the effect of less favorable weather compared to the same
period in 2007 and decreased electricity usage primarily during the unbilled sales period. Hurricane Gustav and
Hurricane Ike, which hit the Utility's service territories in September 2008, contributed an estimated $46 million to
the decrease in electricity usage. Industrial sales were also depressed by the continuing effects of the hurricanes and,
especially in the latter part of the year, because of the overall decline of the economy, leading to lower usage in the
latter part of the year affecting both the large customer industrial segment as well as small and mid-sized industrial
customers. The decreases in electricity usage were partially offset by an increase in residential and commercial
customer electricity usage that occurred during the periods of the year not affected by the hurricanes.
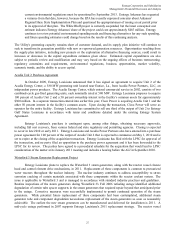
The retail electric price variance is primarily due to:
an increase in the Attala power plant costs recovered through the power management rider by Entergy
Mississippi. The net income effect of this recovery is limited to a portion representing an allowed return on
equity with the remainder offset by Attala power plant costs in other operation and maintenance expenses,
depreciation expenses, and taxes other than income taxes;
a storm damage rider that became effective in October 2007 at Entergy Mississippi; and
an Energy Efficiency rider that became effective in November 2007 at Entergy Arkansas.
The establishment of the storm damage rider and the Energy Efficiency rider results in an increase in rider revenue
and a corresponding increase in other operation and maintenance expense with no impact on net income. The retail
electric price variance was partially offset by:
the absence of interim storm recoveries through the formula rate plans at Entergy Louisiana and Entergy
Gulf States Louisiana which ceased upon the Act 55 financing of storm costs in the third quarter 2008; and
a credit passed on to customers as a result of the Act 55 storm cost financings.
Refer to "Liquidity and Capital Resources - Hurricane Katrina and Hurricane Rita" below and Note 2 to the
financial statements for a discussion of the interim recovery of storm costs and the Act 55 storm cost financings.
Non-Utility Nuclear
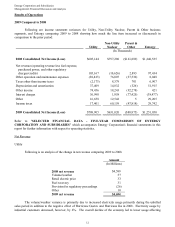
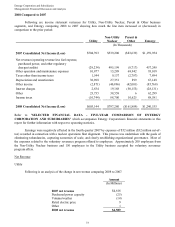
Following is an analysis of the change in net revenue comparing 2008 to 2007.
Amount
(In Millions)
2007 net revenue $1,839
Realized price changes 309
Palisades acquisition 98
Volume variance (other than Palisades) 73
Fuel expenses (other than Palisades) (19)
Other 34
2008 net revenue $2,334
As shown in the table above, net revenue for Non-Utility Nuclear increased by $495 million, or 27%, in 2008
compared to 2007 primarily due to higher pricing in its contracts to sell power, additional production available from
the acquisition of Palisades in April 2007, and fewer outage days. In addition to the refueling outages shown in the
19