Entergy 2009 Annual Report Download - page 123
Download and view the complete annual report
Please find page 123 of the 2009 Entergy annual report below. You can navigate through the pages in the report by either clicking on the pages listed below, or by using the keyword search tool below to find specific information within the annual report.-
 1
1 -
2
-
3
-
4
-
5
-
6
-
7
-
8
-
9
-
10
-
11
-
12
-
13
-
14
-
15
-
16
-
17
-
18
-
19
-
20
-
21
-
22
-
23
-
24
-
25
-
26
-
27
-
28
-
29
-
30
-
31
-
32
-
33
-
34
-
35
-
36
-
37
-
38
-
39
-
40
-
41
-
42
-
43
-
44
-
45
-
46
-
47
-
48
-
49
-
50
-
51
-
52
-
53
-
54
-
55
-
56
-
57
-
58
-
59
-
60
-
61
-
62
-
63
-
64
-
65
-
66
-
67
-
68
-
69
-
70
-
71
-
72
-
73
-
74
-
75
-
76
-
77
-
78
-
79
-
80
-
81
-
82
-
83
-
84
-
85
-
86
-
87
-
88
-
89
-
90
-
91
-
92
-
93
-
94
-
95
-
96
-
97
-
98
-
99
-
100
-
101
-
102
-
103
-
104
-
105
-
106
-
107
-
108
-
109
-
110
-
111
-
112
-
 113
113 -
 114
114 -
 115
115 -
 116
116 -
 117
117 -
 118
118 -
 119
119 -
 120
120 -
 121
121 -
 122
122 -
 123
123 -
 124
124 -
 125
125 -
 126
126 -
 127
127 -
 128
128 -
 129
129 -
 130
130 -
 131
131 -
 132
132 -
 133
133 -
134
-
135
-
136
-
137
-
138
-
139
-
140
-
141
-
142
-
143
-
144
-
145
-
146
-
147
-
148
-
149
-
150
-
151
-
152
-
153
-
154
 |
 |

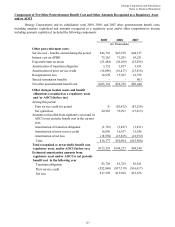
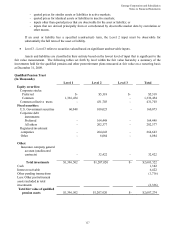
Entergy Corporation and Subsidiaries
Notes to Financial Statements
119
Qualified Pension Obligations, Plan Assets, Funded Status, Amounts Recognized in the Balance Sheet for
Entergy Corporation and its Subsidiaries as of December 31, 2009 and 2008
December 31,
2009 2008
(In Thousands)
Change in Projected Benefit Obligation (PBO)
Balance at beginning of year $3,305,315 $3,247,724
Service cost 89,646 90,392
Interest cost 218,172 206,586
Actuarial loss/(gain) 385,221 (89,124)
Employee contributions 852 902
Benefits paid (161,462) (151,165)
Balance at end of year $3,837,744 $3,305,315
Change in Plan Assets
Fair value of assets at beginning of year $2,078,252 $2,764,383
Actual return on plan assets 557,642 (823,636)
Employer contributions 131,990 287,768
Employee contributions 852 902
Acquisition - -
Benefits paid (161,462) (151,165)
Fair value of assets at end of year $2,607,274 $2,078,252
Funded status ($1,230,470) ($1,227,063)
Amount recognized in the balance sheet
Non-current liabilities ($1,230,470) ($1,227,063)
Amount recognized as a regulatory asset
Prior service cost $16,376 $20,548
Net loss 1,183,824 1,150,298
$1,200,200 $1,170,846
Amount recognized as AOCI (before tax)
Prior service cost $4,116 $4,941
Net loss 297,507 276,635
$301,623 $281,576
121