Entergy 2009 Annual Report Download - page 63
Download and view the complete annual report
Please find page 63 of the 2009 Entergy annual report below. You can navigate through the pages in the report by either clicking on the pages listed below, or by using the keyword search tool below to find specific information within the annual report.-
 1
1 -
2
-
3
-
4
-
5
-
6
-
7
-
8
-
9
-
10
-
11
-
12
-
13
-
14
-
15
-
16
-
17
-
18
-
19
-
20
-
21
-
22
-
23
-
24
-
25
-
26
-
27
-
28
-
29
-
30
-
31
-
32
-
33
-
34
-
35
-
36
-
37
-
38
-
39
-
40
-
41
-
42
-
43
-
44
-
45
-
46
-
47
-
48
-
49
-
50
-
51
-
52
-
 53
53 -
 54
54 -
 55
55 -
 56
56 -
 57
57 -
 58
58 -
 59
59 -
 60
60 -
 61
61 -
 62
62 -
 63
63 -
 64
64 -
 65
65 -
 66
66 -
 67
67 -
 68
68 -
 69
69 -
 70
70 -
 71
71 -
 72
72 -
 73
73 -
74
-
75
-
76
-
77
-
78
-
79
-
80
-
81
-
82
-
83
-
84
-
85
-
86
-
87
-
88
-
89
-
90
-
91
-
92
-
93
-
94
-
95
-
96
-
97
-
98
-
99
-
100
-
101
-
102
-
103
-
104
-
105
-
106
-
107
-
108
-
109
-
110
-
111
-
112
-
113
-
114
-
115
-
116
-
117
-
118
-
119
-
120
-
121
-
122
-
123
-
124
-
125
-
126
-
127
-
128
-
129
-
130
-
131
-
132
-
133
-
134
-
135
-
136
-
137
-
138
-
139
-
140
-
141
-
142
-
143
-
144
-
145
-
146
-
147
-
148
-
149
-
150
-
151
-
152
-
153
-
154
 |
 |

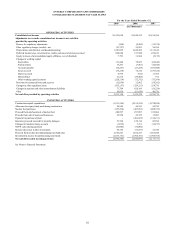
2009 2008 2007
(In Thousands, Except Share Data)
OPERATING REVENUES
Electric $7,880,016 $10,073,160 $9,046,301
Natural gas 172,213 241,856 206,073
Competitive businesses 2,693,421 2,778,740 2,232,024
TOTAL 10,745,650 13,093,756 11,484,398
OPERATING EXPENSES
Operating and Maintenance:
Fuel, fuel-related expenses, and
gas purchased for resale 2,309,831 3,577,764 2,934,833
Purchased power 1,395,203 2,491,200 1,986,950
Nuclear refueling outage expenses 241,310 221,759 180,971
Other operation and maintenance 2,750,810 2,742,762 2,649,654
Decommissioning 199,063 189,409 167,898
Taxes other than income taxes 503,859 496,952 489,058
Depreciation and amortization 1,082,775 1,030,860 963,712
Other regulatory charges (credits) - net (21,727) 59,883 54,954
TOTAL 8,461,124 10,810,589 9,428,030
OPERATING INCOME 2,284,526 2,283,167 2,056,368
OTHER INCOME
Allowance for equity funds used during construction 59,545 44,523 42,742
Interest and dividend income 236,628 197,872 238,911
Other than temporary impairment losses (86,069) (49,656) (4,914)
Equity in earnings (loss) of unconsolidated equity affiliates (7,793) (11,684) 3,176
Miscellaneous - net (32,603) (11,768) (24,860)
TOTAL 169,708 169,287 255,055
INTEREST AND OTHER CHARGES
Interest on long-term debt 520,716 500,898 506,089
Other interest - net 82,963 133,290 155,995
Allowance for borrowed funds used during construction (33,235) (25,267) (25,032)
TOTAL 570,444 608,921 637,052
INCOME BEFORE INCOME TAXES 1,883,790 1,843,533 1,674,371
Income taxes 632,740 602,998 514,417
CONSOLIDATED NET INCOME 1,251,050 1,240,535 1,159,954
Preferred dividend requirements of subsidiaries 19,958 19,969 25,105
NET INCOME ATTRIBUTABLE TO ENTERGY CORPORATION $1,231,092 $1,220,566 $1,134,849
Earnings per average common share:
Basic $6.39 $6.39 $5.77
Diluted $6.30 $6.20 $5.60
Dividends declared per common share $3.00 $3.00 $2.58
Basic average number of common shares outstanding 192,772,032 190,925,613 196,572,945
Diluted average number of common shares outstanding 195,838,068 201,011,588 202,780,283
See Notes to Financial Statements.
CONSOLIDATED STATEMENTS OF INCOME
ENTERGY CORPORATION AND SUBSIDIARIES
For the Years Ended December 31,
61