Entergy 2009 Annual Report Download - page 24
Download and view the complete annual report
Please find page 24 of the 2009 Entergy annual report below. You can navigate through the pages in the report by either clicking on the pages listed below, or by using the keyword search tool below to find specific information within the annual report.-
 1
1 -
2
-
3
-
4
-
5
-
6
-
7
-
8
-
9
-
10
-
11
-
12
-
13
-
 14
14 -
 15
15 -
 16
16 -
 17
17 -
 18
18 -
 19
19 -
 20
20 -
 21
21 -
 22
22 -
 23
23 -
 24
24 -
 25
25 -
 26
26 -
 27
27 -
 28
28 -
 29
29 -
 30
30 -
 31
31 -
 32
32 -
 33
33 -
 34
34 -
35
-
36
-
37
-
38
-
39
-
40
-
41
-
42
-
43
-
44
-
45
-
46
-
47
-
48
-
49
-
50
-
51
-
52
-
53
-
54
-
55
-
56
-
57
-
58
-
59
-
60
-
61
-
62
-
63
-
64
-
65
-
66
-
67
-
68
-
69
-
70
-
71
-
72
-
73
-
74
-
75
-
76
-
77
-
78
-
79
-
80
-
81
-
82
-
83
-
84
-
85
-
86
-
87
-
88
-
89
-
90
-
91
-
92
-
93
-
94
-
95
-
96
-
97
-
98
-
99
-
100
-
101
-
102
-
103
-
104
-
105
-
106
-
107
-
108
-
109
-
110
-
111
-
112
-
113
-
114
-
115
-
116
-
117
-
118
-
119
-
120
-
121
-
122
-
123
-
124
-
125
-
126
-
127
-
128
-
129
-
130
-
131
-
132
-
133
-
134
-
135
-
136
-
137
-
138
-
139
-
140
-
141
-
142
-
143
-
144
-
145
-
146
-
147
-
148
-
149
-
150
-
151
-
152
-
153
-
154
 |
 |

Entergy Corporation and Subsidiaries
Management's Financial Discussion and Analysis
20
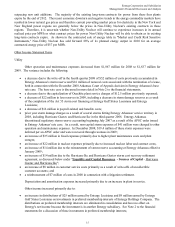
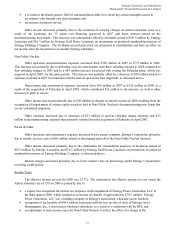
methodology of computing Massachusetts state income taxes resulting from legislation passed in the third
quarter 2008, which resulted in an income tax benefit of approximately $18.8 million.
These factors were partially offset by:
income taxes recorded by Entergy Power Generation, LLC, prior to its liquidation, resulting from the
redemption payments it received in connection with its investment in Entergy Nuclear Power Marketing,
LLC during the third quarter 2008, which resulted in an income tax expense of approximately $16.1 million;
and
book and tax differences for utility plant items and state income taxes at the Utility operating companies,
including the flow-through treatment of the Entergy Arkansas write-offs discussed above.
The effective income tax rate for 2007 was 30.7%. The reduction in the effective income tax rate versus the
federal statutory rate of 35% in 2007 is primarily due to:
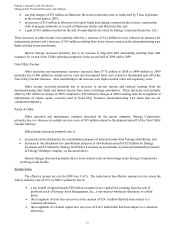
a reduction in income tax expense due to a step-up in the tax basis on the Indian Point 2 non-qualified
decommissioning trust fund resulting from restructuring of the trusts, which reduced deferred taxes on the
trust fund and reduced current tax expense;
the resolution of tax audit issues involving the 2002-2003 audit cycle;
an adjustment to state income taxes for Non-Utility Nuclear to reflect the effect of a change in the
methodology of computing New York state income taxes as required by that state's taxing authority;
book and tax differences related to the allowance for equity funds used during construction; and
the amortization of investment tax credits.
These factors were partially offset by book and tax differences for utility plant items and state income taxes at the
Utility operating companies.
See Note 3 to the financial statements for a reconciliation of the federal statutory rate of 35.0% to the
effective income tax rates, and for additional discussion regarding income taxes.
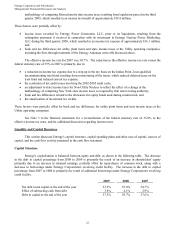
Liquidity and Capital Resources
This section discusses Entergy's capital structure, capital spending plans and other uses of capital, sources of
capital, and the cash flow activity presented in the cash flow statement.
Capital Structure
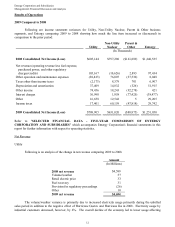
Entergy's capitalization is balanced between equity and debt, as shown in the following table. The decrease
in the debt to capital percentage from 2008 to 2009 is primarily the result of an increase in shareholders' equity
primarily due to an increase in retained earnings, partially offset by repurchases of common stock, along with a
decrease in borrowings under Entergy Corporation's revolving credit facility. The increase in the debt to capital
percentage from 2007 to 2008 is primarily the result of additional borrowings under Entergy Corporation's revolving
credit facility.
2009 2008 2007
Net debt to net capital at the end of the year 53.5% 55.6% 54.7%
Effect of subtracting cash from debt 3.8% 4.1% 2.9%
Debt to capital at the end of the year 57.3% 59.7% 57.6%
22