Entergy 2009 Annual Report Download - page 127
Download and view the complete annual report
Please find page 127 of the 2009 Entergy annual report below. You can navigate through the pages in the report by either clicking on the pages listed below, or by using the keyword search tool below to find specific information within the annual report.-
 1
1 -
2
-
3
-
4
-
5
-
6
-
7
-
8
-
9
-
10
-
11
-
12
-
13
-
14
-
15
-
16
-
17
-
18
-
19
-
20
-
21
-
22
-
23
-
24
-
25
-
26
-
27
-
28
-
29
-
30
-
31
-
32
-
33
-
34
-
35
-
36
-
37
-
38
-
39
-
40
-
41
-
42
-
43
-
44
-
45
-
46
-
47
-
48
-
49
-
50
-
51
-
52
-
53
-
54
-
55
-
56
-
57
-
58
-
59
-
60
-
61
-
62
-
63
-
64
-
65
-
66
-
67
-
68
-
69
-
70
-
71
-
72
-
73
-
74
-
75
-
76
-
77
-
78
-
79
-
80
-
81
-
82
-
83
-
84
-
85
-
86
-
87
-
88
-
89
-
90
-
91
-
92
-
93
-
94
-
95
-
96
-
97
-
98
-
99
-
100
-
101
-
102
-
103
-
104
-
105
-
106
-
107
-
108
-
109
-
110
-
111
-
112
-
113
-
114
-
115
-
116
-
 117
117 -
 118
118 -
 119
119 -
 120
120 -
 121
121 -
 122
122 -
 123
123 -
 124
124 -
 125
125 -
 126
126 -
 127
127 -
 128
128 -
 129
129 -
 130
130 -
 131
131 -
 132
132 -
 133
133 -
 134
134 -
 135
135 -
 136
136 -
 137
137 -
138
-
139
-
140
-
141
-
142
-
143
-
144
-
145
-
146
-
147
-
148
-
149
-
150
-
151
-
152
-
153
-
154
 |
 |

Entergy Corporation and Subsidiaries
Notes to Financial Statements
123
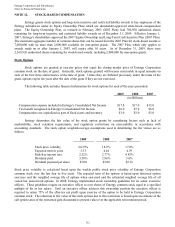
Qualified Pension and Other Postretirement Plans' Assets
Entergy's qualified pension and postretirement plans' weighted-average asset allocations by asset category at
December 31, 2009 and 2008 are as follows:
Qualified Pension Postretirement
Actual Asset Allocation 2009 2008 2009 2008
Non-
Taxable Taxable
Non-
Taxable Taxable
Domestic Equity Securities 46% 43% 40% 36% 37% 37%
International Equity Securities 21% 19% 19% 0% 17% 0%
Fixed Income Securities 32% 36% 41% 63% 46% 63%
Other 1% 2% 0% 1% 0% 0%
The Plan Administrator's trust asset investment strategy is to invest the assets in a manner whereby long term
earnings on the assets (plus cash contributions) provide adequate funding for retiree benefit payments. The mix of
assets is based on an optimization study that identifies asset allocation targets in order to achieve the maximum
return for an acceptable level of risk, while minimizing the expected contributions and pension and postretirement
expense.
In the optimization study, the Plan Administrator formulates assumptions about characteristics, such as
expected asset class investment returns, volatility (risk), and correlation coefficients among the various asset classes.
The future market assumptions used in the optimization study are determined by examining historical market
characteristics of the various asset classes, and making adjustments to reflect future conditions expected to prevail
over the study period.
The optimization analysis utilized in the Plan Administrator's latest study produced the following approved
asset class target allocations.
Target Asset Allocation Pension Postretirement
Non-Taxable Taxable
Domestic Equity Securities 45% 38% 35%
International Equity Securities 20% 17% 0%
Fixed Income Securities 35% 45% 65%
The expected long term rate of return of 8.5% for 2010 and 2009 for the qualified retirement plans assets is
based on the expected long term return of each asset class, weighted by the target allocation for each class as defined
in the table above. The source for each asset class’ expected long term rate of return is the geometric mean of the
respective asset class’ historical total return. The time period reflected in the total returns is a long dated period
spanning several decades.
The expected long term rate of return of 7.75% for 2010 (8.5% for 2009) for the non-taxable postretirement
trust assets is based on the expected long term return of each asset class, weighted by the target allocation for each
class as defined in the table above. The source for each asset class’ expected long term rate of return is the geometric
mean of the respective asset class’ historical total return. The time period reflected in the total returns is a long dated
period spanning several decades.
For the taxable postretirement trust assets the investment allocation includes a high percentage of tax-exempt
fixed income securities. The tax-exempt fixed income long term total return was estimated using historical total
return data from the 2009 Econom ic Re port of t he P resident. The time period reflected in the tax-exempt fixed
income total return is 1940 to 2008. After reflecting the tax-exempt fixed income percentage and unrelated business
125