Entergy 2009 Annual Report Download - page 137
Download and view the complete annual report
Please find page 137 of the 2009 Entergy annual report below. You can navigate through the pages in the report by either clicking on the pages listed below, or by using the keyword search tool below to find specific information within the annual report.-
 1
1 -
2
-
3
-
4
-
5
-
6
-
7
-
8
-
9
-
10
-
11
-
12
-
13
-
14
-
15
-
16
-
17
-
18
-
19
-
20
-
21
-
22
-
23
-
24
-
25
-
26
-
27
-
28
-
29
-
30
-
31
-
32
-
33
-
34
-
35
-
36
-
37
-
38
-
39
-
40
-
41
-
42
-
43
-
44
-
45
-
46
-
47
-
48
-
49
-
50
-
51
-
52
-
53
-
54
-
55
-
56
-
57
-
58
-
59
-
60
-
61
-
62
-
63
-
64
-
65
-
66
-
67
-
68
-
69
-
70
-
71
-
72
-
73
-
74
-
75
-
76
-
77
-
78
-
79
-
80
-
81
-
82
-
83
-
84
-
85
-
86
-
87
-
88
-
89
-
90
-
91
-
92
-
93
-
94
-
95
-
96
-
97
-
98
-
99
-
100
-
101
-
102
-
103
-
104
-
105
-
106
-
107
-
108
-
109
-
110
-
111
-
112
-
113
-
114
-
115
-
116
-
117
-
118
-
119
-
120
-
121
-
122
-
123
-
124
-
125
-
126
-
 127
127 -
 128
128 -
 129
129 -
 130
130 -
 131
131 -
 132
132 -
 133
133 -
 134
134 -
 135
135 -
 136
136 -
 137
137 -
 138
138 -
 139
139 -
 140
140 -
 141
141 -
 142
142 -
 143
143 -
 144
144 -
 145
145 -
 146
146 -
 147
147 -
148
-
149
-
150
-
151
-
152
-
153
-
154
 |
 |

Entergy Corporation and Subsidiaries
Notes to Financial Statements
133
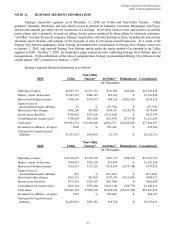
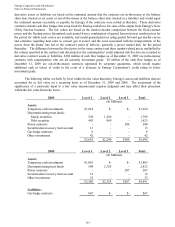
NOTE 13. BUSINESS SEGMENT INFORMATION
Entergy's reportable segments as of December 31, 2009 are Utility and Non-Utility Nuclear. Utility
generates, transmits, distributes, and sells electric power in portions of Arkansas, Louisiana, Mississippi, and Texas,
and provides natural gas utility service in portions of Louisiana. Non-Utility Nuclear owns and operates six nuclear
power plants and is primarily focused on selling electric power produced by those plants to wholesale customers.
"All Other" includes the parent company, Entergy Corporation, and other business activity, including the non-nuclear
wholesale assets business and earnings on the proceeds of sales of previously-owned businesses. As a result of the
Entergy New Orleans bankruptcy filing, Entergy discontinued the consolidation of Entergy New Orleans retroactive
to January 1, 2005, and reported Entergy New Orleans results under the equity method of accounting in the Utility
segment in 2006. On May 7, 2007, the bankruptcy judge entered an order confirming Entergy New Orleans' plan of
reorganization. With confirmation of the plan of reorganization, Entergy reconsolidated Entergy New Orleans in the
second quarter 2007, retroactive to January 1, 2007.
Entergy's segment financial information is as follows:
2009 Utility
Non-Utility
Nuclear* All Other* Eliminations Consolidated
(In Thousands)
Operating revenues $8,055,353 $2,555,254 $161,506 ($26,463) $10,745,650
Deprec., amort. & decomm. $1,025,922 $240,747 $15,169 $- $1,281,838
Interest and dividend income $180,505 $170,033 $88,106 ($202,016) $236,628
Equity in loss of
unconsolidated equity affiliates $1 $- ($7,794) $- ($7,793)
Interest and other charges $462,206 $55,884 $180,931 ($128,577) $570,444
Income taxes (benefits) $388,682 $379,266 ($135,208) $- $632,740
Consolidated net income (loss) $708,905 $631,020 ($15,437) ($73,438) $1,251,050
Total assets $29,694,732 $10,590,809 ($294,277) ($2,626,667) $37,364,597
Investment in affiliates - at equity $200 $- $39,380 $- $39,580
Cash paid for long-lived asset
additions $1,872,997 $654,003 $1,719 $- $2,528,719
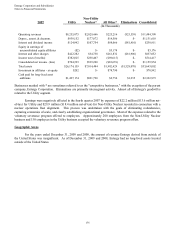
2008 Utility
Non-Utility
Nuclear* All Other* Eliminations Consolidated
(In Thousands)
Operating revenues $10,318,630 $2,558,378 $241,715 ($24,967) $13,093,756
Deprec., amort. & decomm. $984,651 $220,128 $15,490 $- $1,220,269
Interest and dividend income $122,657 $112,129 $116,830 ($153,744) $197,872
Equity in loss of
unconsolidated equity affiliates ($3) $- ($11,681) $- ($11,684)
Interest and other charges $425,216 $53,926 $243,745 ($113,966) $608,921
Income taxes (benefits) $371,281 $319,107 ($87,390) $- $602,998
Consolidated net income (loss) $605,144 $797,280 ($122,110) ($39,779) $1,240,535
Total assets $28,810,147 $7,848,195 $2,586,456 ($2,627,980) $36,616,818
Investment in affiliates - at equity $199 $- $66,048 $- $66,247
Cash paid for long-lived asset
additions $2,478,014 $478,285 $18,730 $- $2,975,029
135