Xcel Energy 2008 Annual Report Download - page 93
Download and view the complete annual report
Please find page 93 of the 2008 Xcel Energy annual report below. You can navigate through the pages in the report by either clicking on the pages listed below, or by using the keyword search tool below to find specific information within the annual report.-
 1
1 -
2
-
3
-
4
-
5
-
6
-
7
-
8
-
9
-
10
-
11
-
12
-
13
-
14
-
15
-
16
-
17
-
18
-
19
-
20
-
21
-
22
-
23
-
24
-
25
-
26
-
27
-
28
-
29
-
30
-
31
-
32
-
33
-
34
-
35
-
36
-
37
-
38
-
39
-
40
-
41
-
42
-
43
-
44
-
45
-
46
-
47
-
48
-
49
-
50
-
51
-
52
-
53
-
54
-
55
-
56
-
57
-
58
-
59
-
60
-
61
-
62
-
63
-
64
-
65
-
66
-
67
-
68
-
69
-
70
-
71
-
72
-
73
-
74
-
75
-
76
-
77
-
78
-
79
-
80
-
81
-
82
-
 83
83 -
 84
84 -
 85
85 -
 86
86 -
 87
87 -
 88
88 -
 89
89 -
 90
90 -
 91
91 -
 92
92 -
 93
93 -
 94
94 -
 95
95 -
 96
96 -
 97
97 -
 98
98 -
 99
99 -
 100
100 -
 101
101 -
 102
102 -
 103
103 -
104
-
105
-
106
-
107
-
108
-
109
-
110
-
111
-
112
-
113
-
114
-
115
-
116
-
117
-
118
-
119
-
120
-
121
-
122
-
123
-
124
-
125
-
126
-
127
-
128
-
129
-
130
-
131
-
132
-
133
-
134
-
135
-
136
-
137
-
138
-
139
-
140
-
141
-
142
-
143
-
144
-
145
-
146
-
147
-
148
-
149
-
150
-
151
-
152
-
153
-
154
-
155
-
156
-
157
-
158
-
159
-
160
-
161
-
162
-
163
-
164
-
165
-
166
-
167
-
168
-
169
-
170
-
171
-
172
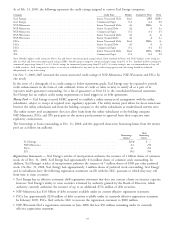
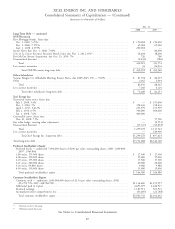
 |
 |

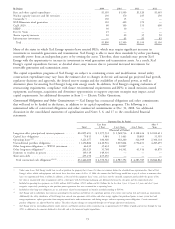
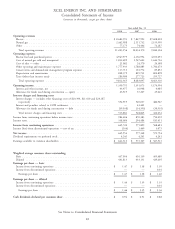
XCEL ENERGY INC. AND SUBSIDIARIES
Consolidated Statements of Cash Flows
(amounts in thousands of dollars)
Year ended Dec. 31
2008 2007(a) 2006
Operating activities
Net income .................................................... $ 645,554 $ 577,348 $ 571,754
Remove loss (income) from discontinued operations ............................ 166 (1,449) (3,073)
Adjustments to reconcile net income to cash provided by operating activities:
Depreciation and amortization ....................................... 883,392 855,897 857,129
Nuclear fuel amortization .......................................... 64,203 53,453 47,531
Deferred income taxes ............................................ 259,045 265,277 (59,843)
Amortization of investment tax credits .................................. (7,198) (8,680) (9,806)
Allowance for equity funds used during construction .......................... (63,519) (37,207) (25,045)
Undistributed equity in earnings of unconsolidated affiliates ...................... (3,571) (1,900) (2,775)
Allowance for bad debts ........................................... 63,407 57,434 56,919
Gain or write down of assets sold or held for sale ............................ — — (6,189)
Share-based compensation expense ..................................... 25,511 22,871 40,384
Net realized and unrealized hedging and derivative transactions .................... (31,895) 6,463 (27,219)
Changes in operating assets and liabilities (net of effects of consolidation of NMC)
Accounts receivable ............................................ (14,108) (136,807) 119,813
Accrued unbilled revenues ........................................ (11,520) (217,659) 99,716
Inventories ................................................. (135,099) (25,464) 28,967
Recoverable purchased natural gas and electric energy costs ..................... 33,947 185,185 136,470
Other current assets ............................................ 11,937 (9,922) (1,831)
Accounts payable ............................................. 28,422 (10,018) (105,707)
Net regulatory assets and liabilities ................................... (70,993) 27,428 (34,211)
Other current liabilities .......................................... 48,819 52,771 97,216
Change in other noncurrent assets ..................................... 54,327 3,265 4,956
Change in other noncurrent liabilities ................................... (97,988) (99,098) (56,415)
Operating cash flows (used in) provided by discontinued operations .................. (3,323) 72,346 195,255
Net cash provided by operating activities ............................... 1,679,516 1,631,534 1,923,996
Investing activities
Utility capital/construction expenditures ................................. (2,112,135) (2,095,721) (1,626,000)
Allowance for equity funds used during construction .......................... 63,519 37,207 25,045
Purchase of investments in external decommissioning fund ...................... (957,752) (712,462) (1,288,103)
Proceeds from the sale of investments in external decommissioning fund .............. 914,514 669,070 1,240,034
Nonregulated capital expenditures and asset acquisitions ........................ (1,111) (1,136) (1,620)
Proceeds from sale of assets ......................................... — — 24,670
Investment in WYCO ............................................ (97,924) (29,659) —
Change in restricted cash .......................................... 32,008 (9,190) 11,813
Cash obtained from consolidation of NMC ............................... — 38,950 —
Other investments, net ........................................... 2,564 20,832 13,535
Investing cash flows provided by discontinued operations ......................... — — 50,516
Net cash used in investing activities .................................. (2,156,317) (2,082,109) (1,550,110)
Financing activities
Proceeds from (repayment of) short-term borrowings, net ....................... (633,310) 462,260 (119,820)
Proceeds from issuance of long-term debt ................................ 1,915,060 1,162,272 1,326,180
Repayment of long-term debt, including reacquisition premiums ................... (581,313) (768,146) (1,285,584)
Proceeds from issuance of common stock ................................. 352,871 10,539 16,275
Dividends paid ................................................ (382,282) (378,892) (358,746)
Early participation payment on debt exchange .............................. — (4,859) —
Net cash (used in) provided by financing activities .......................... 671,026 483,174 (421,695)
Net increase (decrease) in cash and cash equivalents ............................ 194,225 32,599 (47,809)
Net increase (decrease) in cash and cash equivalents — discontinued operations ........... 3,853 (18,937) 13,071
Cash and cash equivalents at beginning of year ............................... 51,120 37,458 72,196
Cash and cash equivalents at end of year .................................. $ 249,198 $ 51,120 $ 37,458
Supplemental disclosure of cash flow information
Cash paid for interest (net of amounts capitalized) ........................... $ 485,373 $ 469,142 $ 427,683
Cash paid for income taxes (net of refunds received) .......................... 94,744 6,467 (13,329)
Supplemental disclosure of non-cash investing transactions:
Property, plant and equipment additions in accounts payable ..................... $ 55,715 $ 39,681 $ 54,102
Supplemental disclosure of non-cash financing transactions:
Issuance of common stock for reinvested dividends and 401(k) plans ................ $ 56,009 $ 53,105 $ 56,194
Issuance of common stock for senior convertible notes ......................... 57,500 229,623 —
(a) See Note 22
See Notes to Consolidated Financial Statements
83