Xcel Energy 2008 Annual Report Download - page 82
Download and view the complete annual report
Please find page 82 of the 2008 Xcel Energy annual report below. You can navigate through the pages in the report by either clicking on the pages listed below, or by using the keyword search tool below to find specific information within the annual report.-
 1
1 -
2
-
3
-
4
-
5
-
6
-
7
-
8
-
9
-
10
-
11
-
12
-
13
-
14
-
15
-
16
-
17
-
18
-
19
-
20
-
21
-
22
-
23
-
24
-
25
-
26
-
27
-
28
-
29
-
30
-
31
-
32
-
33
-
34
-
35
-
36
-
37
-
38
-
39
-
40
-
41
-
42
-
43
-
44
-
45
-
46
-
47
-
48
-
49
-
50
-
51
-
52
-
53
-
54
-
55
-
56
-
57
-
58
-
59
-
60
-
61
-
62
-
63
-
64
-
65
-
66
-
67
-
68
-
69
-
70
-
71
-
 72
72 -
 73
73 -
 74
74 -
 75
75 -
 76
76 -
 77
77 -
 78
78 -
 79
79 -
 80
80 -
 81
81 -
 82
82 -
 83
83 -
 84
84 -
 85
85 -
 86
86 -
 87
87 -
 88
88 -
 89
89 -
 90
90 -
 91
91 -
 92
92 -
93
-
94
-
95
-
96
-
97
-
98
-
99
-
100
-
101
-
102
-
103
-
104
-
105
-
106
-
107
-
108
-
109
-
110
-
111
-
112
-
113
-
114
-
115
-
116
-
117
-
118
-
119
-
120
-
121
-
122
-
123
-
124
-
125
-
126
-
127
-
128
-
129
-
130
-
131
-
132
-
133
-
134
-
135
-
136
-
137
-
138
-
139
-
140
-
141
-
142
-
143
-
144
-
145
-
146
-
147
-
148
-
149
-
150
-
151
-
152
-
153
-
154
-
155
-
156
-
157
-
158
-
159
-
160
-
161
-
162
-
163
-
164
-
165
-
166
-
167
-
168
-
169
-
170
-
171
-
172
 |
 |

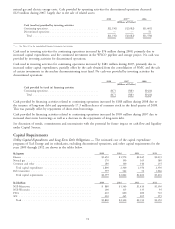
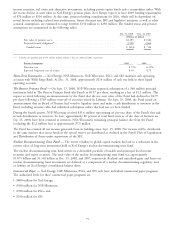
natural gas and electric energy costs. Cash provided by operating activities for discontinued operations decreased
$123 million during 2007, largely due to the sale of related assets.
2008 2007(a) 2006
(Millions of Dollars)
Cash (used in) provided by investing activities
Continuing operations .............................. $(2,156) $(2,082) $(1,601)
Discontinued operations ............................. — — 51
Total ....................................... $(2,156) $(2,082) $(1,550)
(a) — See Note 22 to the consolidated financial statements for revision.
Cash used in investing activities for continuing operations increased by $74 million during 2008, primarily due to
increased capital expenditures, and the continued investment in the WYCO pipeline and storage project. No cash was
provided by investing activities for discontinued operations.
Cash used in investing activities for continuing operations increased by $481 million during 2007, primarily due to
increased utility capital expenditures, partially offset by the cash obtained from the consolidation of NMC and the sale
of certain investments in the nuclear decommissioning trust fund. No cash was provided by investing activities for
discontinued operations.
2008 2007 2006
(Millions of Dollars)
Cash provided by (used in) financing activities
Continuing operations .............................. $671 $483 $(422)
Total ....................................... $671 $483 $(422)
Cash provided by financing activities related to continuing operations increased by $188 million during 2008 due to
the issuance of long-term debt and approximately 17.3 million shares of common stock in the third quarter of 2008.
This was partially offset by repayments of short-term borrowings.
Cash provided by financing activities related to continuing operations increased by $905 million during 2007 due to
increased short-term borrowings as well as a decrease in the repayments of long-term debt.
See discussion of trends, commitments and uncertainties with the potential for future impact on cash flow and liquidity
under Capital Sources.
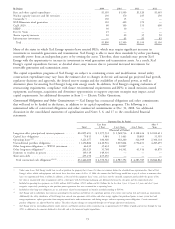
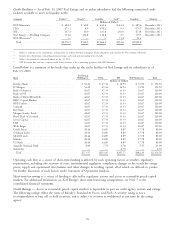
Capital Requirements
Utility Capital Expenditures and Long-Term Debt Obligations — The estimated cost of the capital expenditure
programs of Xcel Energy and its subsidiaries, excluding discontinued operations, and other capital requirements for the
years 2009 through 2012 are shown in the tables below.
By Segment 2009 2010 2011 2012
Electric ......................................... $1,450 $1,970 $2,045 $2,035
Natural gas ....................................... 170 190 165 180
Common and other ................................. 180 140 140 135
Total capital expenditures ............................ 1,800 2,300 2,350 2,350
Debt maturities .................................... 559 542 52 1,066
Total capital requirements ............................ $2,359 $2,842 $2,402 $3,416
By Subsidiary 2009 2010 2011 2012
NSP-Minnesota .................................... $ 880 $1,340 $1,410 $1,350
NSP-Wisconsin .................................... 100 115 135 95
PSCo .......................................... 610 600 600 710
SPS ........................................... 210 245 205 195
Total ......................................... $1,800 $2,300 $2,350 $2,350
72