Xcel Energy 2008 Annual Report Download - page 124
Download and view the complete annual report
Please find page 124 of the 2008 Xcel Energy annual report below. You can navigate through the pages in the report by either clicking on the pages listed below, or by using the keyword search tool below to find specific information within the annual report.-
 1
1 -
2
-
3
-
4
-
5
-
6
-
7
-
8
-
9
-
10
-
11
-
12
-
13
-
14
-
15
-
16
-
17
-
18
-
19
-
20
-
21
-
22
-
23
-
24
-
25
-
26
-
27
-
28
-
29
-
30
-
31
-
32
-
33
-
34
-
35
-
36
-
37
-
38
-
39
-
40
-
41
-
42
-
43
-
44
-
45
-
46
-
47
-
48
-
49
-
50
-
51
-
52
-
53
-
54
-
55
-
56
-
57
-
58
-
59
-
60
-
61
-
62
-
63
-
64
-
65
-
66
-
67
-
68
-
69
-
70
-
71
-
72
-
73
-
74
-
75
-
76
-
77
-
78
-
79
-
80
-
81
-
82
-
83
-
84
-
85
-
86
-
87
-
88
-
89
-
90
-
91
-
92
-
93
-
94
-
95
-
96
-
97
-
98
-
99
-
100
-
101
-
102
-
103
-
104
-
105
-
106
-
107
-
108
-
109
-
110
-
111
-
112
-
113
-
 114
114 -
 115
115 -
 116
116 -
 117
117 -
 118
118 -
 119
119 -
 120
120 -
 121
121 -
 122
122 -
 123
123 -
 124
124 -
 125
125 -
 126
126 -
 127
127 -
 128
128 -
 129
129 -
 130
130 -
 131
131 -
 132
132 -
 133
133 -
 134
134 -
135
-
136
-
137
-
138
-
139
-
140
-
141
-
142
-
143
-
144
-
145
-
146
-
147
-
148
-
149
-
150
-
151
-
152
-
153
-
154
-
155
-
156
-
157
-
158
-
159
-
160
-
161
-
162
-
163
-
164
-
165
-
166
-
167
-
168
-
169
-
170
-
171
-
172
 |
 |

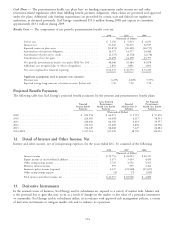
Cash Flows — The postretirement health care plans have no funding requirements under income tax and other
retirement-related regulations other than fulfilling benefit payment obligations, when claims are presented and approved
under the plans. Additional cash funding requirements are prescribed by certain state and federal rate regulatory
authorities, as discussed previously. Xcel Energy contributed $55.6 million during 2008 and expects to contribute
approximately $63.1 million during 2009.
Benefit Costs — The components of net periodic postretirement benefit costs are:
2008 2007 2006
(Thousands of Dollars)
Service cost .................................... $ 5,350 $ 5,813 $ 6,633
Interest cost .................................... 51,047 50,475 52,939
Expected return on plan assets ......................... (31,851) (30,401) (26,757)
Amortization of transition obligation ..................... 14,577 14,577 14,444
Amortization of prior service credit ...................... (2,175) (2,178) (2,178)
Amortization of net loss gain .......................... 11,498 14,198 24,797
Net periodic postretirement benefit cost under SFAS No. 106 ..... 48,446 52,484 69,878
Additional cost recognized due to effects of regulation .......... 3,891 3,891 3,891
Net cost recognized for financial reporting ................. $52,337 $ 56,375 $ 73,769
Significant assumptions used to measure costs (income):
Discount rate ................................... 6.25% 6.00% 5.75%
Expected average long-term rate of return on assets (before tax) .... 7.50 7.50 7.50
Projected Benefit Payments
The following table lists Xcel Energy’s projected benefit payments for the pension and postretirement benefit plans:
Gross Projected Net Projected
Projected Postretirement Expected Postretirement
Pension Benefit Health Care Benefit Medicare Part D Health Care Benefit
Payments Payments Subsidies Payments
(Thousands of Dollars)
2009 .............................. $ 224,558 $ 62,975 $ 5,725 $ 57,250
2010 .............................. 226,585 64,468 6,117 58,351
2011 .............................. 226,446 66,390 6,433 59,957
2012 .............................. 230,763 67,400 6,804 60,596
2013 .............................. 234,149 68,008 7,127 60,881
2014-2018 .......................... 1,237,114 351,249 38,796 312,453
12. Detail of Interest and Other Income, Net
Interest and other income, net of nonoperating expenses, for the years ended Dec. 31 consisted of the following:
2008 2007 2006
(Thousands of Dollars)
Interest income .................................. $29,753 $ 24,093 $ 20,317
Equity income in unconsolidated affiliates .................. 3,571 3,459 4,450
Other nonoperating income .......................... 5,725 4,352 5,253
Minority interest income ............................ 595 599 2,361
Insurance policy income (expense) ...................... 4,337 (21,548) (27,637)
Other nonoperating expense .......................... (4) (7) (659)
Total interest and other income, net ..................... $43,977 $ 10,948 $ 4,085
13. Derivative Instruments
In the normal course of business, Xcel Energy and its subsidiaries are exposed to a variety of market risks. Market risk
is the potential loss or gain that may occur as a result of changes in the market or fair value of a particular instrument
or commodity. Xcel Energy and its subsidiaries utilize, in accordance with approved risk management policies, a variety
of derivative instruments to mitigate market risk and to enhance its operations.
114