Xcel Energy 2008 Annual Report Download - page 119
Download and view the complete annual report
Please find page 119 of the 2008 Xcel Energy annual report below. You can navigate through the pages in the report by either clicking on the pages listed below, or by using the keyword search tool below to find specific information within the annual report.-
 1
1 -
2
-
3
-
4
-
5
-
6
-
7
-
8
-
9
-
10
-
11
-
12
-
13
-
14
-
15
-
16
-
17
-
18
-
19
-
20
-
21
-
22
-
23
-
24
-
25
-
26
-
27
-
28
-
29
-
30
-
31
-
32
-
33
-
34
-
35
-
36
-
37
-
38
-
39
-
40
-
41
-
42
-
43
-
44
-
45
-
46
-
47
-
48
-
49
-
50
-
51
-
52
-
53
-
54
-
55
-
56
-
57
-
58
-
59
-
60
-
61
-
62
-
63
-
64
-
65
-
66
-
67
-
68
-
69
-
70
-
71
-
72
-
73
-
74
-
75
-
76
-
77
-
78
-
79
-
80
-
81
-
82
-
83
-
84
-
85
-
86
-
87
-
88
-
89
-
90
-
91
-
92
-
93
-
94
-
95
-
96
-
97
-
98
-
99
-
100
-
101
-
102
-
103
-
104
-
105
-
106
-
107
-
108
-
 109
109 -
 110
110 -
 111
111 -
 112
112 -
 113
113 -
 114
114 -
 115
115 -
 116
116 -
 117
117 -
 118
118 -
 119
119 -
 120
120 -
 121
121 -
 122
122 -
 123
123 -
 124
124 -
 125
125 -
 126
126 -
 127
127 -
 128
128 -
 129
129 -
130
-
131
-
132
-
133
-
134
-
135
-
136
-
137
-
138
-
139
-
140
-
141
-
142
-
143
-
144
-
145
-
146
-
147
-
148
-
149
-
150
-
151
-
152
-
153
-
154
-
155
-
156
-
157
-
158
-
159
-
160
-
161
-
162
-
163
-
164
-
165
-
166
-
167
-
168
-
169
-
170
-
171
-
172
 |
 |

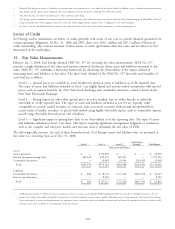
Cash received from stock options exercised and actual tax benefit realized for the tax deductions from stock options
exercised during the years ended Dec. 31 were as follows:
2008 2007 2006
(Thousands of Dollars)
Cash received from stock options exercised ................. $214 $5,266 $10,231
Tax benefit realized for the tax deductions from stock options
exercised ..................................... — — 353
11. Benefit Plans and Other Postretirement Benefits
Xcel Energy offers various benefit plans to its employees. Approximately 50 percent of employees that receive benefits
are represented by several local labor unions under several collective-bargaining agreements. At Dec. 31, 2008:
• NSP-Minnesota had 2,279 and NSP-Wisconsin had 403 bargaining employees covered under a collective-
bargaining agreement, which expires at the end of 2010. NSP-Minnesota also had an additional 209 nuclear
operation bargaining employees covered under several collective-bargaining agreements, which expire at various
dates through September 2010.
• PSCo had 2,159 bargaining employees covered under a collective-bargaining agreement, which expires in May
2009.
• SPS had 804 bargaining employees covered under a collective-bargaining agreement, which expires in October
2011.
Employers’ Accounting for Defined Benefit Pension and Other Postretirement Plans — an amendment of FASB
Statements No. 87, 88, 106, and 132(R) (SFAS No. 158) — In September 2006, the FASB issued SFAS No. 158,
which requires companies to fully recognize the funded status of each pension and other postretirement benefit plan as
a liability or asset on their balance sheets with all unrecognized amounts to be recorded in other comprehensive income.
Xcel Energy applied regulatory accounting treatment for unrecognized amounts of regulated utility subsidiary
employees, which allowed recognition as a regulatory asset or liability rather than as a charge to accumulated other
comprehensive income, as future costs are expected to be included in rates. The effect of adopting in 2006 for the
remaining unrecognized amounts was an increase in accumulated other comprehensive income of $72.8 million.
Pension Benefits
Xcel Energy has several noncontributory, defined benefit pension plans that cover almost all employees. Benefits are
based on a combination of years of service, the employee’s average pay and social security benefits. Xcel Energy’s policy
is to fully fund into an external trust the actuarially determined pension costs recognized for ratemaking and financial
reporting purposes, subject to the limitations of applicable employee benefit and tax laws.
Pension Plan Assets — Plan assets principally consist of the common stock of public companies, corporate bonds and
U.S. government securities. The target range for our pension asset allocation is 52 percent in equity investments,
25 percent in fixed income investments and 23 percent in nontraditional investments, such as real estate, private equity
and a diversified commodities index.
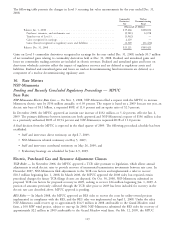
The actual composition of pension plan assets at Dec. 31 was:
2008 2007
Equity securities ............................................ 55% 60%
Debt securities ............................................. 26 22
Real estate ................................................ 5 4
Cash ................................................... 3 2
Nontraditional investments ..................................... 11 12
100% 100%
Xcel Energy bases its investment-return assumption on expected long-term performance for each of the investment types
included in its pension asset portfolio. Xcel Energy considers the actual historical returns achieved by its asset portfolio
over the past 20-year or longer period, as well as the long-term return levels projected and recommended by investment
experts. The historical weighted average annual return for the past 20 years for the Xcel Energy portfolio of pension
investments is 9.56 percent, which is greater than the current assumption level. The pension cost determination assumes
109