Xcel Energy 2008 Annual Report Download - page 70
Download and view the complete annual report
Please find page 70 of the 2008 Xcel Energy annual report below. You can navigate through the pages in the report by either clicking on the pages listed below, or by using the keyword search tool below to find specific information within the annual report.-
 1
1 -
2
-
3
-
4
-
5
-
6
-
7
-
8
-
9
-
10
-
11
-
12
-
13
-
14
-
15
-
16
-
17
-
18
-
19
-
20
-
21
-
22
-
23
-
24
-
25
-
26
-
27
-
28
-
29
-
30
-
31
-
32
-
33
-
34
-
35
-
36
-
37
-
38
-
39
-
40
-
41
-
42
-
43
-
44
-
45
-
46
-
47
-
48
-
49
-
50
-
51
-
52
-
53
-
54
-
55
-
56
-
57
-
58
-
59
-
 60
60 -
 61
61 -
 62
62 -
 63
63 -
 64
64 -
 65
65 -
 66
66 -
 67
67 -
 68
68 -
 69
69 -
 70
70 -
 71
71 -
 72
72 -
 73
73 -
 74
74 -
 75
75 -
 76
76 -
 77
77 -
 78
78 -
 79
79 -
 80
80 -
81
-
82
-
83
-
84
-
85
-
86
-
87
-
88
-
89
-
90
-
91
-
92
-
93
-
94
-
95
-
96
-
97
-
98
-
99
-
100
-
101
-
102
-
103
-
104
-
105
-
106
-
107
-
108
-
109
-
110
-
111
-
112
-
113
-
114
-
115
-
116
-
117
-
118
-
119
-
120
-
121
-
122
-
123
-
124
-
125
-
126
-
127
-
128
-
129
-
130
-
131
-
132
-
133
-
134
-
135
-
136
-
137
-
138
-
139
-
140
-
141
-
142
-
143
-
144
-
145
-
146
-
147
-
148
-
149
-
150
-
151
-
152
-
153
-
154
-
155
-
156
-
157
-
158
-
159
-
160
-
161
-
162
-
163
-
164
-
165
-
166
-
167
-
168
-
169
-
170
-
171
-
172
 |
 |

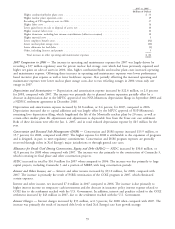
Interest charges increased by $33 million, or 6.8 percent, for 2007 compared with 2006. The increase is due to higher
levels of both short-term and long-term debt and higher interest rates.
Income Taxes — Income taxes for continuing operations increased by $44.2 million for 2008, compared with 2007.
The increase in income tax expense was primarily due to an increase in pretax income in 2008. The effective tax rate
for continuing operations was 34.4 percent for 2008, compared with 33.8 percent for 2007.
Income taxes for continuing operations increased by $113 million for 2007, compared with 2006. The increase in
income tax expense was primarily due to an increase in pretax income (excluding COLI) and $16.1 million of tax
expense related to the COLI settlement in 2007 and $29.9 million of tax benefits from the reversal of a regulatory
reserve and realized capital loss carryforwards in 2006. The effective tax rate for 2007 was 33.8 percent, compared with
24.2 percent for the same period in 2006. The higher effective tax rate for 2007 was primarily due to the COLI
settlement and the lower effective tax rate for 2006 was primarily due to the recognition of a tax benefit relating to the
reversal of a regulatory reserve and realized capital loss carryforwards. Without these charges and benefits, the effective
tax rate for 2007 and 2006 would have been 30.3 percent and 28.2 percent, respectively.
See Note 8 to the consolidated financial statements.
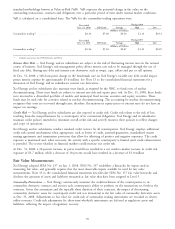
Holding Company and Other Results
The following tables summarize the net income and earnings per share contributions of the continuing operations of
Xcel Energy’s nonregulated businesses and holding company results:
Contribution to Xcel Energy’s earnings
2008 2007 2006
(Millions of Dollars)
Financing costs and preferred dividends — holding company ...... $(69.7) $(71.9) $(66.1)
Eloigne ....................................... 1.5 2.6 4.6
Holding company, taxes and other results .................. 5.3 9.2 24.2
Total holding company and other loss — continuing operations . . $(62.9) $(60.1) $(37.3)
Contribution to Xcel Energy’s earnings per share
2008 2007 2006
Financing costs and preferred dividends — holding company ...... $(0.15) $(0.15) $(0.12)
Eloigne ....................................... — — 0.01
Holding company, taxes and other results .................. 0.01 0.03 0.05
Total holding company and other loss per share — continuing
operations .................................. $(0.14) $(0.12) $(0.06)
Financing Costs and Preferred Dividends — Holding company and other results include interest expense and the
earnings-per-share impact of preferred dividends, which are incurred at the Xcel Energy and intermediate holding
company levels, and are not directly assigned to individual subsidiaries.
Factors Affecting Results of Continuing Operations
Xcel Energy’s utility revenues depend on customer usage, which varies with weather conditions, general business
conditions and the cost of energy services. Various regulatory agencies approve the prices for electric and natural gas
service within their respective jurisdictions and affect Xcel Energy’s ability to recover its costs from customers. The
historical and future trends of Xcel Energy’s operating results have been, and are expected to be, affected by a number
of factors, including those listed below.
General Economic Conditions
Economic conditions may have a material impact on Xcel Energy’s operating results. Management cannot predict the
impact of a prolonged economic recession, fluctuating energy prices, terrorist activity, war or the threat of war.
However, Xcel Energy could experience a material adverse impact to its results of operations, future growth or ability to
raise capital resulting from a general slowdown in future economic growth or a significant increase in interest rates.
60