Xcel Energy 2008 Annual Report Download - page 69
Download and view the complete annual report
Please find page 69 of the 2008 Xcel Energy annual report below. You can navigate through the pages in the report by either clicking on the pages listed below, or by using the keyword search tool below to find specific information within the annual report.-
 1
1 -
2
-
3
-
4
-
5
-
6
-
7
-
8
-
9
-
10
-
11
-
12
-
13
-
14
-
15
-
16
-
17
-
18
-
19
-
20
-
21
-
22
-
23
-
24
-
25
-
26
-
27
-
28
-
29
-
30
-
31
-
32
-
33
-
34
-
35
-
36
-
37
-
38
-
39
-
40
-
41
-
42
-
43
-
44
-
45
-
46
-
47
-
48
-
49
-
50
-
51
-
52
-
53
-
54
-
55
-
56
-
57
-
58
-
 59
59 -
 60
60 -
 61
61 -
 62
62 -
 63
63 -
 64
64 -
 65
65 -
 66
66 -
 67
67 -
 68
68 -
 69
69 -
 70
70 -
 71
71 -
 72
72 -
 73
73 -
 74
74 -
 75
75 -
 76
76 -
 77
77 -
 78
78 -
 79
79 -
80
-
81
-
82
-
83
-
84
-
85
-
86
-
87
-
88
-
89
-
90
-
91
-
92
-
93
-
94
-
95
-
96
-
97
-
98
-
99
-
100
-
101
-
102
-
103
-
104
-
105
-
106
-
107
-
108
-
109
-
110
-
111
-
112
-
113
-
114
-
115
-
116
-
117
-
118
-
119
-
120
-
121
-
122
-
123
-
124
-
125
-
126
-
127
-
128
-
129
-
130
-
131
-
132
-
133
-
134
-
135
-
136
-
137
-
138
-
139
-
140
-
141
-
142
-
143
-
144
-
145
-
146
-
147
-
148
-
149
-
150
-
151
-
152
-
153
-
154
-
155
-
156
-
157
-
158
-
159
-
160
-
161
-
162
-
163
-
164
-
165
-
166
-
167
-
168
-
169
-
170
-
171
-
172
 |
 |

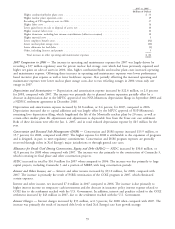
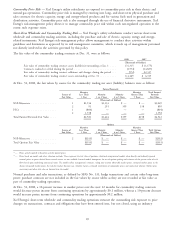
2007 vs. 2006
(Millions of Dollars)
Higher combustion/hydro plant costs ....................................... $ 33
Higher nuclear plant operation costs ....................................... 19
Recording of PFS regulatory asset in 2006 .................................... 17
Higher labor costs ................................................... 16
Lower gains/losses on sale or disposal of assets, net .............................. 10
Higher contract labor costs ............................................. 10
Higher donations, including low income contributions (offset in revenues) ................ 10
Higher material costs ................................................. 5
Lower employee benefit costs ............................................ (32)
Lower nuclear plant outage costs .......................................... (10)
Lower allowance for bad debts ........................................... (1)
Other, including licenses and permits ....................................... 5
Total increase in other operating and maintenance expenses ....................... $ 82
2007 Comparison to 2006 — The increase in operating and maintenance expenses for 2007 was largely driven by
recording a $17 million regulatory asset for private nuclear fuel storage costs which had been previously expensed and
higher net gains on sales of assets in 2006. Also, higher combustion/hydro and nuclear plant costs increased operating
and maintenance expense. Offsetting these increases in operating and maintenance expenses were lower performance
based incentive plan expense as well as lower healthcare expense. Also partially offsetting the increased operating and
maintenance expenses were lower nuclear plant outage costs, due to two refueling outages in 2006 versus only one
outage in 2007.
Depreciation and Amortization — Depreciation and amortization expense increased by $22.6 million, or 2.8 percent
for 2008, compared with 2007. The increase was primarily due to planned system expansion partially offset by a
decrease in depreciation due to the MPUC approval of two NSP-Minnesota depreciation filings in September 2008 and
a NDPSC settlement agreement in December 2008.
Depreciation and amortization expense increased by $2.8 million, or 0.4 percent, for 2007, compared to 2006.
Depreciation increased due to capital additions and was largely offset by the MPUC approval of NSP-Minnesota’s
remaining lives depreciation filing, which lengthened the life of the Monticello nuclear plant by 20 years, as well as
certain other smaller plant life adjustments and adjustments to depreciable lives from the Texas rate case settlement.
Both of these decisions were effective Jan. 1, 2007, and in total reduced depreciation expense by $45 million for the
year.
Conservation and Demand Side Management (DSM) — Conservation and DSM expense increased $15.9 million, or
15.7 percent, for 2008, compared with 2007. The higher expense for 2008 is attributable to the expansion of programs
and is designed, in part, to meet regulatory commitments. Conservation and DSM program expenses are generally
recovered through riders in Xcel Energy’s major jurisdictions or through general rate cases.
Allowance for Funds Used During Construction, Equity and Debt (AFDC) — AFDC increased by $30.8 million, or
42.8 percent, for 2008 when compared with 2007. The increase was due primarily to the construction of Comanche 3,
which is nearing its final phase and other construction projects.
AFDC increased in total by $16.0 million for 2007 when compared to 2006. The increase was due primarily to large
capital projects, including Comanche 3 and a portion of MERP, with long construction periods.
Interest and Other Income, net — Interest and other income increased by $33.0 million, for 2008, compared with
2007. The increase is primarily the result of PSRI’s termination of the COLI program in 2007, which eliminated
certain expenses.
Interest and other income, net increased $7.0 million in 2007 compared to 2006. The increase is due primarily to
higher interest income on temporary cash investments and the decrease in insurance policy interest expense related to
COLI due to the settlement reached with the U.S. Government. In addition, interest and penalties related to the COLI
settlement increased by $43 million in 2007, due to the settlement reached with the U.S. Government.
Interest Charges — Interest charges increased by $33 million, or 6.3 percent, for 2008 when compared with 2007. The
increase was primarily the result of increased debt levels to fund Xcel Energy’s rate base growth strategy.
59