Xcel Energy 2008 Annual Report Download - page 113
Download and view the complete annual report
Please find page 113 of the 2008 Xcel Energy annual report below. You can navigate through the pages in the report by either clicking on the pages listed below, or by using the keyword search tool below to find specific information within the annual report.-
 1
1 -
2
-
3
-
4
-
5
-
6
-
7
-
8
-
9
-
10
-
11
-
12
-
13
-
14
-
15
-
16
-
17
-
18
-
19
-
20
-
21
-
22
-
23
-
24
-
25
-
26
-
27
-
28
-
29
-
30
-
31
-
32
-
33
-
34
-
35
-
36
-
37
-
38
-
39
-
40
-
41
-
42
-
43
-
44
-
45
-
46
-
47
-
48
-
49
-
50
-
51
-
52
-
53
-
54
-
55
-
56
-
57
-
58
-
59
-
60
-
61
-
62
-
63
-
64
-
65
-
66
-
67
-
68
-
69
-
70
-
71
-
72
-
73
-
74
-
75
-
76
-
77
-
78
-
79
-
80
-
81
-
82
-
83
-
84
-
85
-
86
-
87
-
88
-
89
-
90
-
91
-
92
-
93
-
94
-
95
-
96
-
97
-
98
-
99
-
100
-
101
-
102
-
 103
103 -
 104
104 -
 105
105 -
 106
106 -
 107
107 -
 108
108 -
 109
109 -
 110
110 -
 111
111 -
 112
112 -
 113
113 -
 114
114 -
 115
115 -
 116
116 -
 117
117 -
 118
118 -
 119
119 -
 120
120 -
 121
121 -
 122
122 -
 123
123 -
124
-
125
-
126
-
127
-
128
-
129
-
130
-
131
-
132
-
133
-
134
-
135
-
136
-
137
-
138
-
139
-
140
-
141
-
142
-
143
-
144
-
145
-
146
-
147
-
148
-
149
-
150
-
151
-
152
-
153
-
154
-
155
-
156
-
157
-
158
-
159
-
160
-
161
-
162
-
163
-
164
-
165
-
166
-
167
-
168
-
169
-
170
-
171
-
172
 |
 |

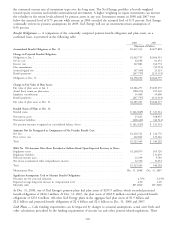
Total income tax expense from continuing operations differs from the amount computed by applying the statutory
federal income tax rate to income before income tax expense. The following is a table reconciling such differences for
the years ending Dec. 31:
2008 2007 2006
Federal statutory rate ............................... 35.0% 35.0% 35.0%
Increases (decreases) in tax from:
State income taxes, net of federal income tax benefit ......... 4.4 4.5 3.0
Life insurance policies ............................ (0.2) (3.7) (4.6)
Tax credits recognized, net of federal income tax expense ....... (1.8) (2.5) (3.2)
Capital loss carry forward utilization ................... — — (2.6)
Resolution of income tax audits and other ................ — (0.7) (1.5)
Regulatory differences — utility plant items ............... (2.1) (1.1) (0.5)
FIN 48 expense — unrecognized tax benefits .............. (0.1) 3.1 —
Other, net .................................... (0.8) (0.8) (1.4)
Effective income tax rate from continuing operations ........... 34.4% 33.8% 24.2%
The components of Xcel Energy’s income tax expense from continuing operations for the years ending Dec. 31 were:
2008 2007 2006
(Thousands of Dollars)
Current federal tax expense ........................... $56,044 $ 10,649 $209,941
Current state tax expense ............................ 26,904 6,726 41,119
Current FIN 48 tax expense .......................... 3,891 20,512 —
Deferred federal tax expense (benefit) .................... 236,307 225,971 (35,795)
Deferred state tax expense (benefit) ...................... 38,758 47,555 (8,503)
Deferred FIN 48 tax (benefit) expense .................... (4,535) 6,926 —
Deferred tax credits ............................... (11,485) (15,175) (15,545)
Deferred investment tax credits ........................ (7,198) (8,680) (9,806)
Total income tax expense from continuing operations ......... $338,686 $294,484 $181,411
The components of Xcel Energy’s net deferred tax liability from continuing operations (current and noncurrent
portions) at Dec. 31 were:
2008 2007
(Thousands of Dollars)
Deferred tax liabilities:
Differences between book and tax bases of property .................... $2,770,768 $2,535,181
Regulatory assets .......................................... 188,603 168,080
Employee benefits ......................................... 40,708 16,707
Deferred costs ............................................ 49,195 101,287
Other ................................................. 57,126 30,507
Total deferred tax liabilities ..................................... $3,106,400 $2,851,762
Deferred tax assets:
Net operating loss carry forward ................................ $ 46,297 $ 77,350
Tax credit carry forward ...................................... 112,952 103,585
Unbilled revenues ......................................... 83,128 73,852
Other comprehensive income .................................. 37,032 19,794
Deferred investment tax credits ................................. 41,460 44,220
Rate refund ............................................. 40,347 23,767
Regulatory liabilities ........................................ 32,444 32,608
Environmental remediation .................................... 28,443 18,438
Bad debts .............................................. 25,136 19,299
Accrued liabilities and other ................................... 18,177 8,574
Total deferred tax assets ....................................... $ 465,416 $ 421,487
Net deferred tax liability ..................................... $2,640,984 $2,430,275
103