Xcel Energy 2008 Annual Report Download - page 120
Download and view the complete annual report
Please find page 120 of the 2008 Xcel Energy annual report below. You can navigate through the pages in the report by either clicking on the pages listed below, or by using the keyword search tool below to find specific information within the annual report.-
 1
1 -
2
-
3
-
4
-
5
-
6
-
7
-
8
-
9
-
10
-
11
-
12
-
13
-
14
-
15
-
16
-
17
-
18
-
19
-
20
-
21
-
22
-
23
-
24
-
25
-
26
-
27
-
28
-
29
-
30
-
31
-
32
-
33
-
34
-
35
-
36
-
37
-
38
-
39
-
40
-
41
-
42
-
43
-
44
-
45
-
46
-
47
-
48
-
49
-
50
-
51
-
52
-
53
-
54
-
55
-
56
-
57
-
58
-
59
-
60
-
61
-
62
-
63
-
64
-
65
-
66
-
67
-
68
-
69
-
70
-
71
-
72
-
73
-
74
-
75
-
76
-
77
-
78
-
79
-
80
-
81
-
82
-
83
-
84
-
85
-
86
-
87
-
88
-
89
-
90
-
91
-
92
-
93
-
94
-
95
-
96
-
97
-
98
-
99
-
100
-
101
-
102
-
103
-
104
-
105
-
106
-
107
-
108
-
109
-
 110
110 -
 111
111 -
 112
112 -
 113
113 -
 114
114 -
 115
115 -
 116
116 -
 117
117 -
 118
118 -
 119
119 -
 120
120 -
 121
121 -
 122
122 -
 123
123 -
 124
124 -
 125
125 -
 126
126 -
 127
127 -
 128
128 -
 129
129 -
 130
130 -
131
-
132
-
133
-
134
-
135
-
136
-
137
-
138
-
139
-
140
-
141
-
142
-
143
-
144
-
145
-
146
-
147
-
148
-
149
-
150
-
151
-
152
-
153
-
154
-
155
-
156
-
157
-
158
-
159
-
160
-
161
-
162
-
163
-
164
-
165
-
166
-
167
-
168
-
169
-
170
-
171
-
172
 |
 |

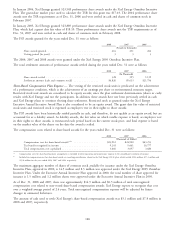
the continued current mix of investment types over the long term. The Xcel Energy portfolio is heavily weighted
toward equity securities and includes nontraditional investments. A higher weighting in equity investments can increase
the volatility in the return levels achieved by pension assets in any year. Investment returns in 2008 and 2007 were
below the assumed level of 8.75 percent while returns in 2006 exceeded the assumed level of 8.75 percent. Xcel Energy
continually reviews its pension assumptions. In 2009, Xcel Energy will use an investment-return assumption of
8.50 percent.
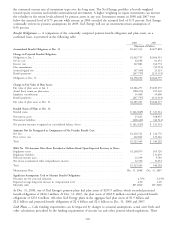
Benefit Obligations — A comparison of the actuarially computed pension-benefit obligation and plan assets, on a
combined basis, is presented in the following table:
2008 2007
(Thousands of Dollars)
Accumulated Benefit Obligation at Dec. 31 ..................................... $2,435,513 $2,497,898
Change in Projected Benefit Obligation:
Obligation at Jan. 1 .................................................... $2,662,759 $2,666,555
Service cost ......................................................... 62,698 61,392
Interest cost ......................................................... 167,881 162,774
Plan amendments ...................................................... — (19,955)
Actuarial (gain) loss .................................................... (47,509) 23,325
Benefit payments ...................................................... (247,797) (231,332)
Obligation at Dec. 31 ................................................... $2,598,032 $2,662,759
Change in Fair Value of Plan Assets:
Fair value of plan assets at Jan. 1 ............................................ $3,186,273 $3,183,375
Actual (loss) return on plan assets ............................................ (788,273) 199,230
Employer contributions .................................................. 35,000 35,000
Benefit payments ...................................................... (247,797) (231,332)
Fair value of plan assets at Dec. 31 ........................................... $2,185,203 $3,186,273
Funded Status of Plans at Dec. 31:
Funded status ........................................................ $(412,829) $ 523,514
Noncurrent assets ...................................................... 15,612 568,055
Noncurrent liabilities ................................................... (428,441) (44,541)
Net pension amounts recognized on consolidated balance sheets ......................... $(412,829) $ 523,514
Amounts Not Yet Recognized as Components of Net Periodic Benefit Cost:
Net loss ............................................................ $1,220,721 $ 216,776
Prior service cost ...................................................... 102,842 123,426
Total ............................................................. $1,323,563 $ 340,202
SFAS No. 158 Amounts Have Been Recorded as Follows Based Upon Expected Recovery in Rates:
Regulatory assets ...................................................... $1,268,879 205,720
Regulatory liabilities .................................................... — 111,650
Deferred income taxes ................................................... 22,294 9,780
Net-of-tax accumulated other comprehensive income ................................ 32,390 13,052
Total ............................................................. $1,323,563 340,202
Measurement Date ..................................................... Dec. 31, 2008 Dec. 31, 2007
Significant Assumptions Used to Measure Benefit Obligations:
Discount rate for year-end valuation .......................................... 6.75% 6.25%
Expected average long-term increase in compensation level ............................ 4.00 4.00
Mortality table ....................................................... RP 2000 RP 2000
At Dec. 31, 2008, one of Xcel Energy’s pension plans had plan assets of $259.9 million, which exceeded projected
benefit obligations of $244.3 million. At Dec. 31, 2007, the plan assets of $369.8 million exceeded projected benefit
obligations of $253.6 million. All other Xcel Energy plans in the aggregate had plan assets of $1.9 billion and
$2.8 billion and projected benefit obligations of $2.4 billion and $2.4 billion on Dec. 31, 2008 and 2007.
Cash Flows — Cash funding requirements can be impacted by changes to actuarial assumptions, actual asset levels and
other calculations prescribed by the funding requirements of income tax and other pension-related regulations. These
110