Xcel Energy 2008 Annual Report Download - page 57
Download and view the complete annual report
Please find page 57 of the 2008 Xcel Energy annual report below. You can navigate through the pages in the report by either clicking on the pages listed below, or by using the keyword search tool below to find specific information within the annual report.-
 1
1 -
 2
2 -
 3
3 -
 4
4 -
 5
5 -
 6
6 -
 7
7 -
 8
8 -
 9
9 -
 10
10 -
 11
11 -
 12
12 -
 13
13 -
 14
14 -
 15
15 -
 16
16 -
 17
17 -
 18
18 -
 19
19 -
 20
20 -
 21
21 -
 22
22 -
 23
23 -
 24
24 -
 25
25 -
 26
26 -
 27
27 -
 28
28 -
 29
29 -
 30
30 -
 31
31 -
 32
32 -
 33
33 -
 34
34 -
 35
35 -
 36
36 -
 37
37 -
 38
38 -
 39
39 -
 40
40 -
 41
41 -
 42
42 -
 43
43 -
 44
44 -
 45
45 -
 46
46 -
 47
47 -
 48
48 -
 49
49 -
 50
50 -
 51
51 -
 52
52 -
 53
53 -
 54
54 -
 55
55 -
 56
56 -
 57
57 -
 58
58 -
 59
59 -
 60
60 -
 61
61 -
 62
62 -
 63
63 -
 64
64 -
 65
65 -
 66
66 -
 67
67 -
 68
68 -
 69
69 -
 70
70 -
 71
71 -
 72
72 -
 73
73 -
 74
74 -
 75
75 -
 76
76 -
 77
77 -
 78
78 -
 79
79 -
 80
80 -
 81
81 -
 82
82 -
 83
83 -
 84
84 -
 85
85 -
 86
86 -
 87
87 -
 88
88 -
 89
89 -
 90
90 -
 91
91 -
 92
92 -
 93
93 -
 94
94 -
 95
95 -
 96
96 -
 97
97 -
 98
98 -
 99
99 -
 100
100 -
 101
101 -
 102
102 -
 103
103 -
 104
104 -
 105
105 -
 106
106 -
 107
107 -
 108
108 -
 109
109 -
 110
110 -
 111
111 -
 112
112 -
 113
113 -
 114
114 -
 115
115 -
 116
116 -
 117
117 -
 118
118 -
 119
119 -
 120
120 -
 121
121 -
 122
122 -
 123
123 -
 124
124 -
 125
125 -
 126
126 -
 127
127 -
 128
128 -
 129
129 -
 130
130 -
 131
131 -
 132
132 -
 133
133 -
 134
134 -
 135
135 -
 136
136 -
 137
137 -
 138
138 -
 139
139 -
 140
140 -
 141
141 -
 142
142 -
 143
143 -
 144
144 -
 145
145 -
 146
146 -
 147
147 -
 148
148 -
 149
149 -
 150
150 -
 151
151 -
 152
152 -
 153
153 -
 154
154 -
 155
155 -
 156
156 -
 157
157 -
 158
158 -
 159
159 -
 160
160 -
 161
161 -
 162
162 -
 163
163 -
 164
164 -
 165
165 -
 166
166 -
 167
167 -
 168
168 -
 169
169 -
 170
170 -
 171
171 -
 172
172
 |
 |

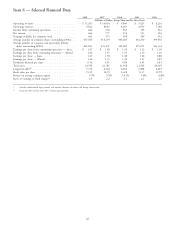
Item 6 — Selected Financial Data
2008 2007 2006 2005 2004
(Millions of Dollars, Except Share and Per Share Data)
Operating revenues ........................ $ 11,203 $ 10,034 $ 9,840 $ 9,625 $ 8,216
Operating expenses ........................ 9,812 8,683 8,663 8,533 7,140
Income from continuing operations .............. 646 576 569 499 522
Net income ............................. 646 577 572 513 356
Earnings available for common stock ............. 641 573 568 509 352
Average number of common shares outstanding (000’s) . . 437,054 416,139 405,689 402,330 399,456
Average number of common and potentially dilutive
shares outstanding (000’s) ................... 441,813 433,131 429,605 425,671 423,334
Earnings per share from continuing operations — basic . . $ 1.47 $ 1.38 $ 1.39 $ 1.23 $ 1.30
Earnings per share from continuing operations — diluted . 1.46 1.35 1.35 1.20 1.26
Earnings per share — basic ................... 1.47 1.38 1.40 1.26 0.88
Earnings per share — diluted .................. 1.46 1.35 1.36 1.23 0.87
Dividends declared per share .................. 0.94 0.91 0.88 0.85 0.81
Total assets ............................. 24,958 23,185 21,958 21.505 20,305
Long-term debt(b) ......................... 7,732 6,342 6,450 5,898 6,493
Book value per share ....................... 15.35 14.70 14.28 13.37 12.99
Return on average common equity ............... 9.7% 9.5% 10.1% 9.6% 6.8%
Ratio of earnings to fixed charges(a) .............. 2.5 2.2 2.2 2.1 2.2
(a) Excludes undistributed equity income and includes allowance for funds used during construction.
(b) Long-term debt includes only debt of continuing operations.
47
