Xcel Energy 2008 Annual Report Download - page 166
Download and view the complete annual report
Please find page 166 of the 2008 Xcel Energy annual report below. You can navigate through the pages in the report by either clicking on the pages listed below, or by using the keyword search tool below to find specific information within the annual report.-
 1
1 -
2
-
3
-
4
-
5
-
6
-
7
-
8
-
9
-
10
-
11
-
12
-
13
-
14
-
15
-
16
-
17
-
18
-
19
-
20
-
21
-
22
-
23
-
24
-
25
-
26
-
27
-
28
-
29
-
30
-
31
-
32
-
33
-
34
-
35
-
36
-
37
-
38
-
39
-
40
-
41
-
42
-
43
-
44
-
45
-
46
-
47
-
48
-
49
-
50
-
51
-
52
-
53
-
54
-
55
-
56
-
57
-
58
-
59
-
60
-
61
-
62
-
63
-
64
-
65
-
66
-
67
-
68
-
69
-
70
-
71
-
72
-
73
-
74
-
75
-
76
-
77
-
78
-
79
-
80
-
81
-
82
-
83
-
84
-
85
-
86
-
87
-
88
-
89
-
90
-
91
-
92
-
93
-
94
-
95
-
96
-
97
-
98
-
99
-
100
-
101
-
102
-
103
-
104
-
105
-
106
-
107
-
108
-
109
-
110
-
111
-
112
-
113
-
114
-
115
-
116
-
117
-
118
-
119
-
120
-
121
-
122
-
123
-
124
-
125
-
126
-
127
-
128
-
129
-
130
-
131
-
132
-
133
-
134
-
135
-
136
-
137
-
138
-
139
-
140
-
141
-
142
-
143
-
144
-
145
-
146
-
147
-
148
-
149
-
150
-
151
-
152
-
153
-
154
-
155
-
 156
156 -
 157
157 -
 158
158 -
 159
159 -
 160
160 -
 161
161 -
 162
162 -
 163
163 -
 164
164 -
 165
165 -
 166
166 -
 167
167 -
 168
168 -
 169
169 -
 170
170 -
 171
171 -
 172
172
 |
 |

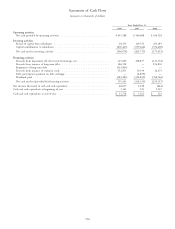
Statements of Cash Flows
(amounts in thousands of dollars)
Years Ended Dec. 31
2008 2007 2006
Operating activities
Net cash provided by operating activities ............................. $455,388 $ 566,688 $ 634,128
Investing activities
Return of capital from subsidiaries ................................. 64,353 129,551 201,185
Capital contributions to subsidiaries ................................ (630,427) (559,266) (576,600)
Net cash used in investing activities ................................ (566,074) (429,715) (375,415)
Financing activities
Proceeds from (repayment of) short-term borrowings, net ................... 125,000 238,877 (211,716)
Proceeds from issuance of long-term debt ............................. 386,518 — 294,830
Repayment of long-term debt .................................... (322,803) — —
Proceeds from issuance of common stock ............................. 352,871 10,539 16,275
Early participation payment on debt exchange .......................... — (4,859) —
Dividends paid ............................................. (382,283) (378,892) (358,746)
Net cash used in (provided by) financing activities ....................... 159,303 (134,335) (259,357)
Net increase (decrease) in cash and cash equivalents ........................ 48,617 2,638 (644)
Cash and cash equivalents at beginning of year ........................... 3,161 523 1,167
Cash and cash equivalents at end of year ............................... $ 51,778 $ 3,161 $ 523
156